Rev Bras Fisiol Exer 2021;20(2):188-99
ORIGINAL ARTICLE
Body composition and physical performance of
schoolchildren in different institutions
Composição
corporal e desempenho físico de escolares em instituições distintas
Caroline
Siriaco Martinez1, Fabrício Madureira1,
Aurea dos Santos Mineiro2, Ivanildo Alves de Souza1,
Roberto Melchior Soares dos Santos1, Dilmar
Pinto Guedes Jr1, Emílson Colantonio2,
Rodrigo Pereira da Silva3
1Universidade Metropolitana de Santos, SP,
Brazil
2Universidade Federal de São Paulo, SP, Brazil
3Faculdade Praia Grande, Universidade
Metropolitana de Santos, Santos, SP, Brazil
Received:
November 17, 2020; Accepted:
January 27, 2021.
Correspondence: Rodrigo Pereira da Silva, Rua Dr. Egydio Martins, 195/43,
11030-161 Santos SP
Caroline Siriaco Martinez:
caah_siriaco@hotmail.com
Fabrício Madureira: shark_jaw@hotmail.com
Aurea dos Santos Mineiro: aurea.ef@gmail.com
Ivanildo Alves de Souza: nenosoccer@bol.com.br
Roberto Melchior Soares dos Santos:
profrobertosantos@unimes.br
Dilmar Pinto Guedes Jr:
dilmarpintoguedesjr@gmmail.com
Emílson Colantonio:
colantonio@unifesp.br
Abstract
Introduction: Technological
advances, poor diet, and physical inactivity are some of the factors
responsible for the increase in the number of children with chronic
degenerative diseases, a current public health problem in different
institutions of private and public education. Aim: analyze, classify, and
compare the body composition and physical performance of students from private
and public schools in coastal cities in São Paulo. Methods: 117
children, 58 volunteers from public schools, and 59 volunteers from private
schools 8 to 11 years old were evaluated. The following evaluations were performed:
anthropometry: body mass, height, body mass index (BMI), and body fat
percentage (%BF) obtained through skinfold measurements (tricipital and
subscapular). Physical performance: flexibility, handgrip strength, abdominal
strength, and endurance. Statistical analysis: after confirming the
non-normality of the data, we opted for the Mann-Whitney U test for comparison
between the groups and the Student’s t-test for comparison between the obtained
value and the normative reference. Results: Children from the private
school, when compared to those from the public school, revealed statistically
significant differences for BMI, %BF, handgrip strength, and abdominal strength
and endurance. Conclusion: These findings denote high values concerning
the reference values for the anthropometric variables and values below the
reference values for the physical performance variables, which can be harmful
to the children’s health in growth and development phase.
Keywords: child; physical activity; public
health.
Resumo
Introdução: O avanço tecnológico, a má alimentação
e a inatividade física são alguns dos responsáveis pelo aumento no número de
crianças que apresentam doenças de caráter crônico degenerativas, problema
atual de saúde pública em diferentes instituições de ensino particular e
público. Objetivo: Analisar,
classificar e comparar a composição corporal e desempenho físico de escolares
de instituições da rede privada e pública de uma cidade litorânea paulista. Métodos:
Foram avaliadas 117 crianças, 58 voluntários de escolas públicas e 59
voluntários de escola particular com idade entre 8 e 11 anos. Foram realizadas
as seguintes avaliações: antropometria: massa corporal, estatura, índice de
massa corpórea (IMC), e percentual de gordura corporal (%GC) obtido por meio da
utilização da medida das dobras cutâneas (tricipital e subescapular).
Desempenho físico: flexibilidade, força de preensão manual, força e resistência
abdominal. Análise estatística: após a confirmação da não normalidade
dos dados, optou-se pelo teste de Mann- -Whitney U para comparação entre os
grupos e o teste t Student para comparação entre o
valor obtido e normativo de referência. Resultados: As crianças da
escola privada quando comparadas às da escola pública revelaram diferenças
estatísticas significativas para IMC, %GC, força de preensão manual e força e
resistência abdominal. Conclusão: Esses achados denotam valores elevados
em relação aos valores de referência para as variáveis antropométricas e
valores abaixo dos valores de referência para as variáveis de desempenho
físico, o que pode ser prejudicial à saúde de crianças em fase de crescimento e
desenvolvimento.
Palavra-chave: criança; atividade física; saúde
pública.
Introduction
Health-related
physical fitness is associated with a better quality of life [1,2], which is
necessary to regulate and maintain motor, morphological and functional levels
with desirable values, minimizing the risk of developing non-communicable
chronic diseases (NCDs) [1,3]. NCDs are responsible for 70% of deaths
worldwide, like obesity, heart disease, stroke, cancer, diabetes, and chronic
lung disease. These range from premature babies to individuals over 70 years
old. Low and middle-income countries are the most affected, with Brazil being
one of them [4]. Four main factors cause NCDs: the consumption of tobacco,
alcohol, poor diet, and physical inactivity [5].
Lack of movement
is one of the central problems and, it may be related to technological advances
and poor diet due to daily running life habits [6]. These factors have become a
current public health problem, with an increase in the children number with
chronic-degenerative diseases, among which obesity stands out [7,8]. The data
presented by the study by Abarca-Gómez et al.
[9] revealed that obesity increased more than ten times in individuals 5 to 19
years old, reaching 124 million people, corroborating the Brazilian Institute
of Geography and Statistics (IBGE), when referring to overweight, the data are
of 34.8% boys and 32% girls and obesity in 16.6% male and 11.8% female [10].
However, for
this index to be identified, it is necessary to perform anthropometric
assessments frequently, being an indication for detecting NCDs [11]. A study by
Dos Santos & Da Silva [12] reveals that students of different levels of
education, from elementary to high school, have lower physical fitness than
expected in both public and private schools, and these results are confirmed in
other studies [13].
These
indications confirm the findings of Pelegrini et
al. [14], who carried out an analysis of physical fitness in students from
public and private institutions in five regions of Brazil, an evaluation about
health criteria in a cross-sectional study, with the participation of 7507
students (4114 boys and 3393 girls), 7 to 10 years old. The above authors
measured body mass, stature, flexibility, muscle strength/resistance, and
cardiorespiratory fitness. For this study, they did not obtain positive results;
concerning physical fitness, flexibility, muscle strength/resistance, and
cardiorespiratory fitness; observing a high prevalence of pre-reached points
established for a physical fitness adequate level.
Specifically, in
a study carried out with children from five regions of Santos city, a low level
of physical fitness was detected, compared to the expected health levels in
public school students. It indicates that sometimes environmental conditions
such as the city characteristics in question, like heat, humidity, and leisure
space, such as the beach, do not seem to be enough to make children more active
and healthier [15]. According to the literature, children currently seem to be
less active and predisposed to developing NCDs. Therefore, from an academic
point of view, it is plausible to investigate populations that reside in
specific locations and that experience different school environments in such a
way as to direct possible changes in public health policies.
Thus, this study
aimed to analyze, classify and compare the body
composition and physical performance of schoolchildren from private and public
institutions in two cities on the coast of São Paulo state.
Methods
The study is an
observational cross-sectional study, and a convenience sample was used. After
the favorable opinion of the Ethics Committee (No. 1.621.19 and CAAE.
54163616.5.0000.5505), all volunteers and guardians signed the Informed Consent
Form. 117 children participated in the study, being 58 students from a public
school (30 female and 28 male) and 59 students from a private school (22 female
and 37 male) aged between 8 and 11 years old, all residents of the city of
Santos and Cubatão. The following topics were defined
as exclusion criteria: refusal to participate in data collection,
non-authorization by parents or guardians, any physical problem that prevented
them temporarily or definitively from carrying out the evaluations,
non-attendance at school on the day scheduled for the collection of data, and
age that was not within the age range of 8 to 14 years.
For
anthropometry, the measurements taken were height, which was determined by the
pocket-sized Cescorf® stadiometer with a 0.1 cm
measurement scale; body mass, using the Tanita® Um-080 portable digital scale,
with 100g precision, according to the standards idealized by Cameron [16].
With the
measures of height and body mass, the body mass index (BMI) was calculated
through the mathematical equation: BMI = Body mass (kg)/height² (m) [kg/m2].
To assess the skin folds thickness, a Cescorf®
Premier Scientific Plicometer was used, with a 0.1 mm
measurement precision. The percentage of body fat (%BF) was determined using
predictive equations idealized by Slaughter et al. [17].
The motor
performance levels were determined based on the analysis of the results
observed through a battery of motor tests proposed by Guedes & Guedes [18],
obeying the following sequence:
The Sit and
reach test – performed with a sit-and-reach box aid, which presents a
measurement with an amplitude of 0 to 50 cm. For this test's application, the
subject was barefoot in a sitting position in front of the device with their
legs under the box, their knees fully extended, and their feet leaning against
it. The arms should be extended over the box surface with the hands placed one
over the other and with the fingertips joined. To record the results, the
subject, with the palms facing down and in contact with the box, performed
trunk flexion to achieve the longest distance possible. The distance reached is
recorded every 0.5 cm, determined by the maximum position reached by the fingertips and maintained for approximately two seconds. To
ensure the result, the evaluator needed to hold the subject's knees. Three
attempts were offered to the subject, and the longest distance achieved to
measure flexibility (FLEX) was computed [19].
The handgrip
test – the measurement of upper limb strength (ULS) was obtained using a Crown
hydraulic manual dynamometer from the Oswaldo Filizola®
industrial technique, respecting the protocol recommended by the American
Association of Hand Therapists, in which those evaluated should remain standing
with their arms extended at their sides, and with the dominant hand make three
attempts for maximum strength with the determined device. The highest value
reached by the subject was adopted after making three attempts. The measurement
unit used in this test was the kilogram-force (kg/f) [20].
Modified sit-up
test (SU) – the subject adopts the supine position on a mat (for more comfort),
flexed hips and knees, and the soles of the feet facing the ground; arms
crossed over the anterior face of the chest, with the palms of the hands facing
the opposite shoulders. The feet must be held by the evaluator while standing
with the feet on the ground. As for the test performance, the subject must
raise the trunk to the level at which contact occurs on the anterior surface of
the forearm with the thighs, immediately returning to the initial position
until it touches at least the anterior half of the scapulae on the ground.
These movements were repeated for 60 seconds, and the purpose of the test was
to perform the greatest number of complete repetitions (rep) possible in the
stipulated time [21].
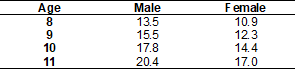
For the tests
carried out, the average value for each age group was assumed, presented in the
reference tables of 1-5 [22] of each test.
Table I - Reference values for BMI
(kg/m2
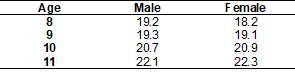
Table II - Reference values of the
abdominal resistance test (rep)
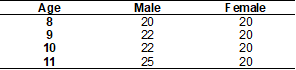
Table III - Flexibility test reference
values (cm)
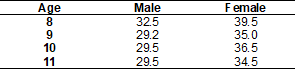
Table IV - Reference values for the
percentage of body fat (%BF)
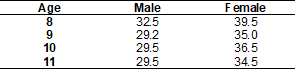
Table V - Reference values for
upper-limb strength (kg/f)
Statistical analysis
After confirming
the non-normality of the data by the Kolmogorov-Smirnov test, the Mann-Whitney
U test was chosen for comparison between the groups. The student's t-test was
used to compare the obtained value with the reference value. And the simple linear
regression analysis was used to verify how much one variable explains the
result of the others.
Results
Figure 1 shows
the comparison between schools, showing a significant difference for the
variables of BMI, %BF, ULS, and SU, with the private school presenting values
related to variables of lower physical fitness when compared to the public one.
The BMI and the %BF were higher for students from the private school, but for
ULS and SU the results were higher in the public school compared to the private
school. For the FLEX variable, there was no statistical difference between the
institutions.
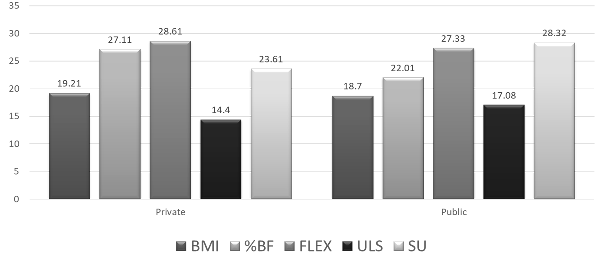
#
indicates a significant difference between groups (private and public
school); The level of significance adopted was p ≤ 0.05
Figure 1 - Comparative data on average
values and standard deviation of the private and public schools for the
variables body mass index (BMI), percentage of body fat (%BF), flexibility
(FLEX), upper limb strength (ULS), and sit-up (SU).
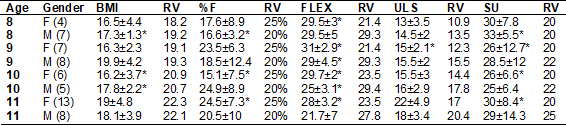
Table VI
presents the results referring to the comparative analysis between the mean
values and standard deviation obtained in the private school and reference
values (RV) related to health in the variables: BMI, %BF, FLEX, ULS, and SU.
Table VI - Variables evaluated in
comparison to the reference value about age and gender in the private school
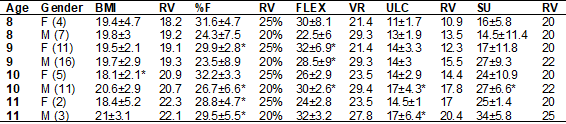
*indicates
a significant difference between the results obtained and the reference values
for health (p ≤ 0.05); the values are in the form of mean and standard
deviation (±); female (F); male (M); body mass index (BMI); reference value
(RV); percentage of fat (%F); flexibility (FLEX); upper limb strength (ULS);
sit-up (SU)
Figure 2 shows
the number of children from the private school who presented values above, on
average, and below the reference value [22] for health for all variables
investigated.
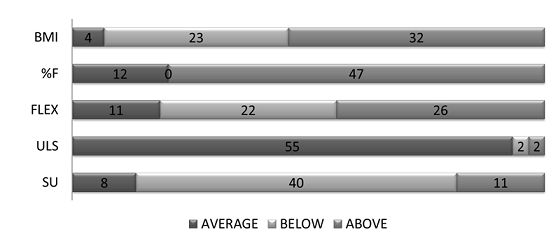
Figure 2 - Representation of the number
of children from the private school who presented values above, on average, and
below the reference value related to health for all variables
Table VI shows
that in the private school, there was a statistical difference for the
variables BMI and %BF when compared to the reference values, and the results
were above expected, for the ages of 9, 10, and 11 years old, in both sexes for
the %BF; and still, values lower than expected for FLEX in boys aged 9 years
old, as well as for SU in girls aged 9 years old. Figure 2 shows the number of
students from the private school in each classification, indicating that 79.6%
of the children are above the reference value for %BF and 54.2% for BMI. In
addition to 40% of children below expectations for SU tests and 22% below for
FLEX tests.
Table VII
presents the results referring to the comparative analysis between the mean
values and standard deviation obtained in the public school and reference
values (RV) related to health in the variables: BMI, %BF, FLEX, ULS, and SU.
Table VII - Variables evaluated in
comparison to the reference value about age and gender in public schools
*indicates
a significant difference between the results obtained and the reference values
for health (p ≤ 0.05); the values are in the form of mean and standard
deviation (±); female (F); male (M); body mass index (BMI); reference value
(RV); percentage of fat (%F); flexibility (FLEX); upper limb strength (ULS);
sit-up (SU)
Figure 3 shows
the number of children from the public school who presented values above, on
average, and below the reference value [22] for health for all variables
investigated.
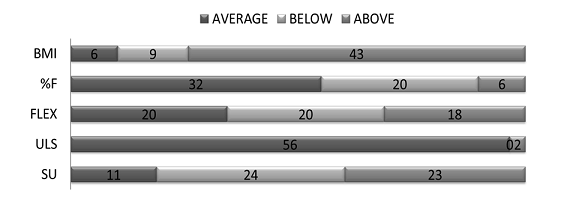
Figure 3 - Representation of the number
of children from the public school who presented values above, on average, and
below the reference value related to health for all variables
The Table VII
indicate that the highest incidence of age variations was found in the FLEX
variable analysis. However, when compared with the reference values, the
students are within the parameters of the expected average values. The
statistical differences presented about the SU test are high when compared to
the reference values. Figure 3 shows the number of public-school students in
each classification for the tests, indicating that 65.5% of the children were classified
in the average or below the reference values for %BF and 84.4% for the BMI.
Table VIII - Linear
regression between %F and SU, FLEX, ULS from private and public schools
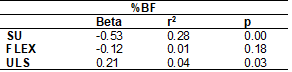
Beta =
Probability distributions; r2 = determination coefficient; p = significance
level
Table VIII
represents the data for the %BF variable compared to the other physical fitness
variables, in which an inverse correlation is observed for SU, with those who
have a higher %BF performing fewer repetitions in the SU test and correlation
for ULS.
Discussion
This study aimed
to analyze, classify, and compare the body composition and physical performance
of students from private and public institutions in coastal cities in São
Paulo. The main findings were high values concerning the reference values for
the anthropometric variables and values below the reference values for the
physical performance variables, especially for children from the private
school. Physical fitness is related to a better quality of life. However, some
factors can harm people's health, and the main factor is a sedentary lifestyle
[1,2].
According to Resende et al. [23], in a systematic review, 27
studies were selected who met all the requirements, and of these 13 studies dealt
with a sedentary lifestyle in children and adolescents from zero to 18 years
old. The authors showed evidence that a sedentary lifestyle due to technology
and obesity have a strong correlation with NCDs, low physical fitness, and
academic performance. The results of the present study showed low physical
fitness for students, regardless of school. For comparison between public and
private schools, significant differences were observed between them,
disagreeing with studies found in the literature. These differences may be
related to the methods adopted in different studies, such as Pinheiro et al.
[24], who investigated only girls of an older age group than the one
investigated in this study.
Hallal et
al. [25] conducted a National Adolescent School-based Health Survey (PeNSE) with 60,973 young people, 9th-grade students from
private and public schools in the capitals of Brazil through questionnaires.
This study revealed that, across the country, a large part of the students is
classified as inactive and insufficiently active and, in the southeastern
region, 50.6% were classified as insufficiently active and 4.1% as inactive.
This is in line with the findings of Abarca-Gómez
[9], which showed an increase in obesity 10 times greater in 2016. In the present
study, an increase in the %BF of students from a private school can be
observed, demonstrating an indication of obesity.
In the
experiment by Dal Mas et al. [26], a study was carried out with 94 students
with an average age of 8 years, evaluating the children's nutritional status,
corroborating the results found for high %F and BMI.
The study
carried out by Andreasi et al. [27] analyzed
988 schoolchildren from different educational, private, philanthropic, and
public-school systems, aged 5 to 17 years, and anthropometric measurements and
physical performance tests were performed. The researchers found that females,
principally, were more prone to abdominal strength/resistance inability, while
obesity and abdominal hyperadiposity predispose
students to abdominal strength/resistance and aerobic resistance inability. The
excess of body adiposity increased the chances of weak trunk flexibility, which
seems to agree with the current study.
The study by
Santos et al. [28] found data like the results found for the %BF of the
present study, and students from the private school also showed higher values than
the public school. Miranda et al. [29] also compared private and public
schools, evaluating 200 students (107 public schools and 93 private schools).
The results agree with those found in the present study, with high BMI and %BF
in private school students. The study by Mineiro et
al. [15] mapped the regions of Santos city, verifying the behavior of the
variables associated with the development and physical fitness related to
children and adolescents' health. The author found results in agreement with
the present study for the variables FLEX and SU. However, for the ULS, the
results differed, since 96.5% of the evaluated were considered within the
expected average values and according to the study by Schuastcer
[30].
Petroski et
al. [31] evaluated 4,495 adolescents aged 14 to 17 years old from the
public system, in which anthropometric assessments and motor tests were carried
out. The results pointed to a classification below the health criterion for
body composition, motor tests, and flexibility, not coinciding with our
findings. It can be speculated that the different results between these two
studies could be related, among other factors, to the different age groups and
the differences between the regions of the research (interior and coast of São
Paulo).
However, Padilha et al. [32] carried out a study in Rio de
Janeiro to investigate the body adiposity indexes (height, body mass, skin
folds, and %BF), nutritional status, and food consumption of schoolchildren of
different socioeconomic levels. The sample was composed of 106 students: 57
from private schools and 49 from public schools with an average age of 12. The
results showed higher adiposity in private school female students when compared
to girls from the public school, corroborating the findings in the present
study. On the other hand, there was no difference between the boys from both
schools about the %BF. However, these data do not confirm our findings of boys
from the private school that presented a high %BF while compared to those
evaluated in the public-school system.
And finally, the
study by Sartorio et al. [33] performed a correlation with the ULS and
anthropometric variables, composed of 332 individuals 5 to 15 years old,
subdivided into 3 groups classified by the state of maturity of Tanner's board,
being group 1 stage 1, group 2 stage 2-3, group 3 stage 4-5. In the 3 groups,
there was a correlation between ULS and %F, supporting this study's finding.
Conclusion
Schools showed
statistical differences for the variables BMI, %BF, ULS, and SU. However, the
private school showed more worrying results concerning health while compared to
the public school. In this regard, children in the private school are above the
reference value for %BF and BMI; and below for performance in the SU test,
while children in the public school are within the values for the same
variables representing positive values for health. School-based lifestyle
change programs oriented to physical fitness and dietary fitness, would perhaps
fulfill the goals of promoting eutrophy and greater
physical fitness for schoolchildren.
Potential conflict of
interest
No potential conflict
of interest relevant to this article was reported.
Authors' contributions
Conception and design
of the research: Mineiro AS, Siriaco
CM. Data collection: Alves IS. Analysis and interpretation of data: Madureira F, Santos RMS, Guedes Jr D. Statistical analysis:
Colantonio E. Writing of the paper: Siriaco CM, Mineiro AS, Silva RP.
Critical review of the paper for important intellectual content: Mineiro AS, Colantonio E, Silva
RP.
References
- Araújo
DSMS, Araújo CGS. Aptidão física, saúde e qualidade de vida
relacionada à saúde em adultos. Rev Bras Med do Esporte 2000;6(5):194-203. doi:
10.1590/S1517-86922000000500005 [Crossref]
- Testa WL, Poeta LS, Duarte MFS. Exercício
físico com atividades recreativas: uma alternativa para o tratamento da
obesidade infantil. Revista Brasileira de Obesidade, Nutrição e Emagrecimento 2017
[Internet];11(62):49-55. [cited 2020 Oct 15].
http://www.rbone.com.br/index.php/rbone/article/view/419
- Lima FEB, Louvison
Junior JN, Pellegrinotti IL, Lima WF, Lima SBS, Lima
FB. Relação entre aptidão física e atividade física de adolescentes de 15 a 18
anos da cidade de Jacarezinho/PR. Biomotriz 2017 [Internet];11(3):51-62. [cited 2020 Oct 15].
Available from:
http://revistaeletronicaocs.unicruz.edu.br/index.php/BIOMOTRIZ/article/view/51-62
- Ministério da Saúde. Obesidade cresce 60%
em dez anos no Brasil. Portal Brasil [Internet] 2017 [citado 2020 Oct 15]. Available from:
https://www.antigo.saude.gov.br/noticias/agencia-saude/28108-em-dez-anos-no-brasil-e-colabora-para-maior-prevalencia-de-hipertensao-e-diabetes
- Global
action plan on physical activity 2018-2030: more active people for a healthier
world. Geneva: World Health Organization [Internet] 2018 [cited 2020 Oct 15].
Available from:
https://www.who.int/ncds/prevention/physical-activity/global-action-plan-2018-2030/en/
- Avaliação de doenças decorrentes da má
alimentação em crianças e adolescentes de Sergipe. São Cristovão: UFS
[Internet] 2018 [cited 2020 Oct 15]. Available from:
https://ri.ufs.br/handle/riufs/7381?locale=en
- Rinaldi AEM, Pereira AF, Macedo CS, Mota JF, Burini RC. Contribuições das práticas alimentares e inatividade física para o excesso de peso infantil. Rev Paul Pediatr 2008;26(3):271-7. doi: 10.1590/S0103-05822008000300012 [Crossref]
- Bacil ED, Watanabe PI, Silva MPD, Fantinelli ER, Bozza R, Campos WD. Validade de um questionário de comportamento sedentário em escolares de 9 a 15 anos de idade. Rev Bras Cienc Saude 2018;22:341-8. doi: 10.22478/ufpb.2317-6032.2018v22n4.37491 [Crossref]
- Bentham J, Di Cesare M, Bilano V, Boddy LM. Worldwide trends in children's and adolescents' body mass index, underweight and obesity, in comparison with adults, from 1975 to 2016: a pooled analysis of 2,416 population-based measurement studies with 128.9 million participants. Lancet 2017;390(10113):2627-42. doi: 10.1016/S0140-6736(1)32129-3 [Crossref]
- IBGE. Sintese de
indicadores sociais. Instituto Brasileiro de Geografia e Estatística; 2005
[Internet].p.207-235. [cited 2020 Oct 15].
Available from:
https://biblioteca.ibge.gov.br/visualizacao/livros/liv29353.pdf
- Januário RSB, Nascimento MA, Barazetti LK, Reichert FF, Mantoan JPB, Oliveira AR. Índice de massa corporal e dobras cutâneas como indicadores de obesidade em escolares de 8 a 10 anos. Rev Bras Cineantropom Desempenho Hum 2008;10(3):266-70. doi: 10.1590/1980-0037.2008v10n3p266 [Crossref]
- Dos Santos VM, Da Silva CC. Impacto de um
processo de intervenção para um estilo de vida saudável em adolescentes. Hórus 2017 [Internet];5(2):233-42. [cited 2020 Oct 15].
Available from: http://periodicos.estacio.br/index.php/revistahorus/article/view/3988
- Oliveira VM, Brasil MR, Gruppi DR, Silva SR. A (in)satisfação da imagem corporal e aptidão física em escolares do primeiro ciclo estudantil. Rev Bras Qual Vida 2017;9(1). doi: 10.3895/rbqv.v9n2.5257 [Crossref]
- Pelegrini A, Silva DAS, Petroski EL, Glaner MF. Aptidão física relacionada à saúde de escolares brasileiros: dados do projeto esporte Brasil. Rev Bras Med Esporte 2011;17(2):92-6. doi: 10.1590/S1517-86922011000200004 [Crossref]
- Mineiro AS. Composição corporal e aptidão
física relacionada à saúde de crianças e adolescentes da cidade de Santos
[Dissertação]. Santos: Unifesp [Internet];
2018. 40f. [cited 2020 Oct 15]. Available from:
https://repositorio.unifesp.br/handle/11600/53127
- Cameron N. The methods of auxological anthropometry. Methodol Ecol Genet Nutr Eff Growth 1986;3-46. doi: 10.1007/978-1-4684-2622-9_3 [Crossref]
- Slaughter
MH, Lohman TG, Boileau RA, Horswill CA, Stillman RJ,
Van Loan MD, et al. Skinfold equations for estimations of body fatness in
children and youth. Hum Biol 1988 [Internet];60(5):709-23. [cited 2020 Oct 15]
Available from: https://pubmed.ncbi.nlm.nih.gov/3224965/
- Guedes DP, Guedes JERP. Manual prático
para avaliação em Educação Física. Barueri/SP: Manole; 2006.
- Wells KF, Dillon EK. The sit and reach: a test of back and leg flexibility. Res Q Am Ass Health 1952;23(1):115-8. doi: 10.1080/10671188.1952.10761965 [Crossref]
- Richards
LG, Olson B, Palmiter-Thomas P. How forearm position
affects grip strength. Am J Occup Ther
1996;50(2):133-8. doi: 10.5014/ajot.50.2.133 [Crossref]
- Meredith
MD. Fitnessgram: Test administration manual.
Champaign, IL: Human Kinetics; 2003.
- Gaya
AGAR. Projeto
Esporte Brasil: manual de testes e avaliação versão 2016 [Internet]. [cited 2020 Oct 15] Available from:
https://www.ufrgs.br/proesp/arquivos/manual-proesp-br-2016.pdf
- Rezende LFM, Lopes MR, Rey-López JP, Matsudo VKR, Luiz ODC. Sedentary behavior and health outcomes: An overview of systematic reviews. PLoSOne 2014;9(8). doi: 10.1371/journal.pone.0105620 [Crossref]
- Pinheiro AM, Vespasiano BS, Montebelo MIL, Cesar MC. Análise da composição corporal,
hábitos alimentares e nível de atividade física de meninas. Rev Cereus 2016 [Internet];8(3):189-204. [cited 2020
Oct 15] Available from:
http://www.ojs.unirg.edu.br/index.php/1/article/view/1335
- Hallal PC, Knuth AG, Cruz DKA, Mendes MI, Malta DC. Prática de
atividade física em adolescentes brasileiros. Cienc Saude Coletiva 2010;15(suppl2):3035-42. doi:
10.1590/S1413-81232010000800008 [Crossref]
- Mas MD, Bernardi JR, Possa G. Fatores
alimentares e nutricionais associados ao hábito de assistir à televisão entre
crianças de uma escola particular de Bento Gonçalves/RS. Rev
Bras Pesqui em Saúde 2017
[Internet];19(2):36-45. [cited 2020 Oct 15] Available from: https://lume.ufrgs.br/handle/10183/180292
- Andreasi V, Michelin E, Rinaldi AEM, Burini RC. Physical fitness and associations with anthropometric measurements in 7 to 15-year-old school children. J Pediatr 2010;86(6):497-502. doi: 10.1590/S0021-75572010000600009 [Crossref]
- Santos CA, Campos ALP, Schild
JFG. Comparação dos níveis de aptidão física e desempenho motor de estudantes de
uma escola pública e uma escola privada da cidade de Pelotas. Rev Bras Prescrição e Fisiologia
do Exercício 2013;7(41):440-8.
- Miranda JMQ, Palmeira MV, Polito LFT, Brandão MRF, Bocalini DS, Junior AJF, Ponciano K, Wichi RB. Prevalência de sobrepeso e obesidade infantil em instituições de ensino: públicas vs. privadas. Rev Bras Med Esporte 2015;21(2):104-7. doi: 10.1590/1517-869220152102143660 [Crossref]
- Schuastcer VR.
Indicadores da aptidão física relacionada à saúde de escolares. [TCC] Santa
Rosa/RS: Universidade Regional do Noroeste do Estado do Rio Grande do Sul; 2018
[Internet]. [cited 2020 Oct 15]
Available from:
https://bibliodigital.unijui.edu.br:8443/xmlui/bitstream/handle/123456789/5176/Vanessa%20Ribeiro%20Schuastcer.pdf?sequence=1&isAllowed=y
- Petroski EL, Silva AF, Rodrigues AB, Pelegrini A. Aptidão física relacionada a saúde em adolescentes brasileiros residentes em áreas de médio/baixo índice de desenvolvimento humano. Rev Salud Pública (Bogota, Colombia) 2011;13:219-28. doi: 10.1590/S0124-00642011000200004 [Crossref]
- Padilha A, de Oliveira GL, Perini TA,
Fernandes Filho J. Composição corporal e estado nutricional de adolescentes de
escola pública e particular do Rio de Janeiro. Acta Brasileira do Movimento
Humano 2010 [Internet] ;1(1). [cited 2020 Oct 15]. Available from:
http://www.periodicos.ulbra.br/index.php/actabrasileira/article/view/3059/2249
- Sartorio A, Lafortuna C, Pogliaghi S, Trecate L. The impact of gender, body dimension and body composition on hand-grip strength in healthy children. J Endocrinol Invest 2002;25(5):431-5. doi: 10.1007/BF03344033 [Crossref]