Rev
Bras Fisiol Exerc 2021;20(2): 130-40
doi: 10.33233/rbfex.v20i2.3974
ORIGINAL
ARTICLE
Effects of strength training and whey proteins
supplementation on the creatinine and urea parameters of rats
Efeitos
do treinamento resistido e da suplementação com whey proteins
sobre os marcadores creatinina e ureia de ratos
Elaine
Paiva Vieira, Antonio Coppi Navarro, Alanna Joselle Santiago Silva,
Francisco Navarro
Universidade
Federal do Maranhão, São Luís, MA, Brazil
Received:
March 17, 2020; Accepted: February 27, 2021.
Correspondence: Elaine Paiva Vieira, Rua da Igreja, 18 Vila Ariri
65082-310 São Luís MA
Elaine Paiva Vieira: paiva.elainev@gmail.com
Antonio Coppi Navarro:
ac-navarro@uol.com.br
Alanna Joselle
Santiago Silva: alanna.santiago.s@gmail.com
Francisco Navarro: francisconavarro@uol.com.br
Abstract
Introduction: High protein
diets increase the concentration of urea and acids in protein metabolism.
Therefore, the use of high doses whey proteins needs to be checked for their
effects on kidney function. Aims: To evaluate the effect of whey proteins
consumption of 2 g kg-1 d-1 and 4 g kg-1 d-1
on the biochemical marker creatinine and urea after 12 weeks of resistance
training in male Wistar rats. Methods: The sample consisted of 52 male
Wistar rats, distributed in 6 groups. The protocol lasted 12 weeks of
resistance training with daily supplementation of whey proteins, in three
sessions per day. The determination of the biochemical concentration consisted
of reading the absorbance and specific equation for the parameter creatinine
and urea. Results: The proportion of creatinine was significantly higher
only in the control group compared to the supplemented groups and the trained
control group. The higher 24-hour creatinine excretion (mg/kg) in the
resistance and supplemented training group compared to the control training
shows a possible effect of resistance training on the increase in muscle mass
associated with a dose 4 g kg-1 d-1. Conclusion:
The treatment of male Wistar rats supplemented with whey proteins at doses 2 g
kg-1 d-1 and 4 g kg-1 d-1 for 12
weeks did not result in impaired renal function.
Keywords: whey proteins; resistance
training; creatinine; urea; rats, Wistar.
Resumo
Introdução: Dietas hiperproteicas
aumentam a concentração de ureia e ácidos, provenientes do metabolismo das
proteínas. Portanto, o uso de altas doses de whey proteins
precisa ser verificado frente aos seus efeitos sob a função renal. Objetivo:
Avaliar o efeito do consumo de 2 g kg-1 d-1 e 4 g kg-1
d-1 whey proteins sobre marcadores
bioquímicos creatinina e ureia após 12 semanas de treinamento resistido em
ratos Wistar. Métodos: Amostra composta por 52
ratos Wistar machos alocados em 6 grupos. O protocolo
teve duração de 12 semanas de treinamento resistido com suplementação diária de
whey proteins. A determinação da concentração dos
marcadores bioquímicos foi constituída de leitura em absorbância e equação
específica dos parâmetros creatinina e ureia. Resultados: A relação
creatinina foi significativamente maior apenas no grupo controle em relação aos
grupos suplementados e ao treinado controle. A maior excreção de creatinina de
24h (mg/kg) no grupo treinamento resistido e suplementado em comparação ao
treinamento controle demonstra possível efeito do treinamento resistido sobre o
aumento da massa muscular associada a dose de 4 g kg-1 d-1.
Conclusão: O tratamento de ratos machos Wistar
suplementados com whey proteins nas doses de 2 g kg-1
d-1 e 4 g kg-1 d-1 durante 12 semanas não
resultou em prejuízo de função renal.
Palavras-chave: proteínas do soro do leite;
treinamento de resistência; creatinine; ureia; ratos Wistar.
Introduction
Whey protein,
commercially known as whey proteins, is a by-product of cheese production and a
rich source of exogenous amino acids and biologically active proteins, in
addition to having nutritional aspects widely studied over the last decades
[1]. It is known that α-lactalbumin and b-lactoglobulin are the main proteins of whey, forming
up to 80% of the protein mass, in addition to containing smaller proteins with
lactoferrin and lactoperoxidase [2,3].
Research has
shown the nutritional qualities of whey proteins which, due to their varied
composition, have become commonly used by athletes with the aim of increasing
muscle mass [1,4]. Thus, the consumption of whey proteins with a concentration
of 80% or even greater than 90% has become increasingly constant in the
population [5].
However, the
excess of whey proteins in the diet can adversely affect the activity of the
organs that participate in its metabolism [6]. One of these organs are the
kidneys. Therefore, the indiscriminate use of protein and amino acid-based
supplements has aroused interest in assessing possible deleterious health
effects associated with the ingestion of excessive doses, especially on renal
function [7].
Due to the high
rates of prevalence and incidence, chronic kidney disease is a relevant public
health problem, affecting thousands of people in Brazil and worldwide [8].
Thus, the use of biomarkers allows an analyze whether there is a lesion and at
what stage it is, such as urea and creatinine, which are metabolites used as
renal markers [9]. Therefore, when evaluating patients with abrupt drops in the
glomerular filtration rate, the relationship between urea and creatinine can be
useful and may be altered in different pathological states [10].
Therefore, the
concentrations of these markers provide important information about renal
function, elevated serum creatinine and urea values may be indicative of renal
injury [11]. Thus, the effects of diets with high doses of whey proteins need
to be verified against pathological changes that may cause interference with
renal function [12,13], due to the increase in glomerular filtration rate and
renal acid load [14,15].
The aim of the
present study was to evaluate the effect of the consumption of 2 g kg-1 d-1 and
4 g kg-1 d-1 of whey proteins on biochemical markers creatinine and urea after
12 weeks of resistance training in sedentary rats in comparison to rats
submitted to resistance training.
Methods
Ethical considerations
The biological
tests were in accordance with the recommendations of the Brazilian Society of
Science in Laboratory Animals [16]. The research project was approved by the
Ethics Committee on the Use of Animals (CEUA), of the Universidade
Federal do Maranhão, under the registration number:
23115.01804 / 2017-91.
Sample
52 males Rattus Novergicus Wistar Albinus were used, with an initial age of
60 days and a body mass of approximately 250 g to 350 g. The rats were
allocated in 6 groups, being: supplemented with 2 g kg-1 d-1
(W2) (n = 10) supplemented with 4 g kg-1 d-1 (W4) (n =
7), resistance training and supplemented with 2 g kg-1 d-1
(TW2) (n = 9), resistance training and supplemented with 4 g kg-1 d-1
(TW4) (n = 6), control (TC) (n = 10) and control (C) (n = 10) training.
The rats
remained under hygienic conditions in collective cages, kept in an
air-conditioned room with temperature control between 24ºC to 28ºC, and under
an alternating light/dark cycle of 12 hours. They were fed ad libitum with
water and standard balanced feed for rodents (Nuvilab
CR-1®).
Statistical analysis
Initially,
normality was assessed using the Shapiro-Wilk test, and found to be normal, the
ANOVA Two-Way test was used to compare the measurement variables. Tukey's
post-hoc was used to determine the statistical differences between all analyzes
with a significance level of p < 0.05, using the statistical software GraphPad
Prism8.1.0.
Resistance training
In week 0,
before the beginning of the experimental protocol, adaptation to training was
carried out. The maximum loaded weight test (PMC), which consisted of up to 9
climbs with an interval of 120 seconds between attempts, was applied 48 hours
after the last training familiarization session.
Adopting 75% of
the rat's total body mass as the initial load for the first climb and the 30 g
increment being added to each attempt. The maximum load adopted was stipulated
according to the load of the last complete climb over the entire length of the
scale.
The test was
considered valid only when the maximum load was identified between 4 and 9
climbs. Otherwise, the test was repeated after 48 hours [17].
The application
of the PCM test was carried out every two weeks, during the 12 weeks of
training in the TC, TW2 and TW4 groups, to identify the maximum load to carry
out the maximum strength adaptations over time and the prescription of load
intensity for resistance training.
Resistance
training had a frequency of 3 weekly sessions, not consecutive. The protocol
used was in accordance with the standardization [18], which consists of 4
climbs on the stairs per training session with increasing intensity of 50%,
75%, 90% and 100% of the Maximum Loaded Weight determined in test [17],
featuring intense resistance training.
Supplementation with whey proteins
The standard
solution was calculated based on the amount of protein (22 g) per portion (25 g)
of the supplement (H.I Whey: Essential Nutrition®) according to the composition
description, using a precision scale for measuring the solute.
The doses
administered were 2 g kg-1 d-1 and 4 g kg-1 d-1
of whey proteins, distributed to the rats, by group, as described in the
resistance training.
Doses were
administered via gavage of a standard solution of whey proteins dissolved in
water with a common concentration of 0.323 g/ml of the Supplement (HI Whey:
Essential Nutrition®), which corresponds to 0.284 g/ml of Whey proteins, with
weekly readjustment based on in the total body mass of the rat.
The treatment
was carried out for 12 weeks, with three sessions of gavage per day with an
interval of 60 minutes. Each gavage was determined according to the rat's total
body mass, with 2 ml for every 100 g of rat's body weight, with a total volume
of 5 ml per gavage session being standardized as stipulated for administration
of aqueous solutions [19]. The control (C) and control training (TC) groups
were treated with water with the same volume of gavage (5 mL).
Twenty-four
hours after the final experimental procedures and with 12 hours of food
deprivation, the rats were euthanized with intraperitoneal injection of
ketamine and xylazine at 70 mg/kg and 10 mg/kg respectively [20]. These
euthanasia criteria were chosen for not causing pain to animals, thus
contemplating the Norms of the National Council for the Control of Animal
Experimentation [21].
Biological material
At the end of
the 12-week experiment, the rats were placed in individual metabolic cages for
24 hours, previously sanitized and the urine was collected, in an environment
with a light/dark cycle, with free access to food and water [22].
To determine the
creatinine concentration, the urine was initially diluted in distilled water
with a proportion of 1:25 mL and then the procedure for deproteinization of the
urine sample in picric acid was carried out, being stirred, and centrifuged at
3000 rpm for 10 minutes. Subsequently, the supernatant was used for analysis to
determine the creatinine concentration by two-point kinetics according to the
reaction with sodium hydroxide. Two readings were taken at 510 nm absorbance at
30 and 90 seconds, which were used in a specific equation to determine the
concentration. The result obtained was multiplied by 25 (Labtest®
- Creatinine K Ref. 96).
To determine
urinary urea, an enzymatic system was used by two-point kinetics, with the
principle of urea hydrolyzing by urease. At first the urine was diluted in
distilled water with a proportion of 1:50 mL and two readings were taken in
absorbance of 340 nm in the times of 30 and 90 seconds, which were used in a
specific equation to determine the concentration. The result obtained was
multiplied by 50 (Labtest® - Creatinine K Ref. 96).
After
euthanasia, blood was collected by beheading in guillotine. For the analysis of
serum creatinine, the procedure for deproteinization of the serum sample in
picric acid was carried out, being agitated, and centrifuged at 3000 rpm for 10
minutes. Then, the liquid supernatant was used for analysis to determine the
creatinine concentration by two-point kinetics according to the reaction with
sodium hydroxide. Two absorbance readings at 510 nm were taken at 30 and 90
seconds, which were used in a specific equation to determine the concentration
(Labtest® - Creatinine K Ref. 96).
To determine the
concentration of urea in the serum, an enzymatic system by two-point kinetics
was used, with the principle of urea hydrolyzing by urease, with two readings
at 340 nm absorbance at 30 and 90 seconds, which were used in equation
concentration determination (Labtest® - Creatinine K
Ref. 96).
Results
Table I - Concentration of urinary
creatinine and urea markers (absolute and for 24 hours), presented as mean and
standard error of the mean
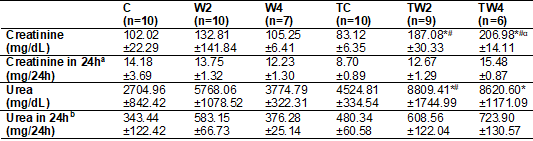
C = Sedentary control
not supplemented; W2 = Sedentary supplemented with 2 g kg-1 d-1;
W4 = Sedentary supplemented with 4 g kg-1 d-1; TC =
Trained not supplemented; TW2 = Trained supplemented with 2 g kg-1 d-1; TW4 =
Trained supplemented with 4 g kg-1 d-1. Two-Way post hoc
Tukey ANOVA (intergroups): Symbols in the horizontal indicate higher mean (p
< 0.05) = *vs. Ç; # vs. TC; α vs. W4. Equations: a = [Creatinine (mg/dl)
x Volume (ml/24h)/100]; b = [Urea (mg/dl) x Volume (mL/24h)/100].
As shown in
table I, in the creatinine marker (mg/dl), there was a higher concentration in
the urine of rats in groups TW2 and TW4 in relation to the control group (p = 0.0196)
and (p = 0.072,) respectively. Similarly, the TW2 and TW4 groups also showed
higher values of creatinine concentration in the urine than the TC group (p =
0.0018) and (p = 0.0008) respectively.
There was no
difference (p > 0.05) between creatinine concentrations for groups
supplemented with 2 g kg-1 d-1. However, for the dose of
4 g kg-1 d-1 there was a difference between the groups,
with greater excretion of creatinine for the group submitted to training.
Groups TW2 and TW4 did not show differences between themselves (p > 0.05) in
urinary creatinine. Groups W2 and W4 also showed no difference between them (p
> 0.05).
In the results
of the urea marker (mg/dL), the TW2 and TW4 groups showed a higher
concentration in the urine compared to the control group (p = 0.0018) and (p =
0.0169) respectively. Similarly, TW2 had a higher concentration of urea
compared to the TC group (p = 0.447).
The control
group and the supplemented groups did not show any difference between
themselves, in the same way, the trained and supplemented groups did not
present differences between them in urinary urea. When observed, however, creatinine
and urea normalized by the 24 h urine volume (mg/24h), all differences in
creatinine and urea in mg/dL were normalized.
Table II - Concentration of serum
creatinine and urea biomarkers presented as mean and standard error of mean
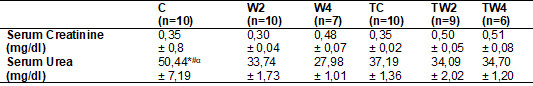
C = Sedentary control
not supplemented; W2 = Sedentary supplemented with 2 g kg-1 d-1;
W4 = Sedentary supplemented with 4 g kg-1 d-1; TC =
Trained not supplemented; TW2 = Trained supplemented with 2 g kg-1
d-1; TW4 = Trained supplemented with 4 g kg-1 d-1.
Two-Way post hoc Tukey ANOVA (intergroups): Symbols in the horizontal indicate
higher mean (p < 0.05) = * vs. W2; # vs. W4; α vs. TW2. Equations: a =
[Creatinine (mg/dl) x Volume (ml/24h)/100]; b = [Urea (mg/dl) x Volume
(ml/24h)/100
According to
table II, there was no significant difference (p > 0.05) in the serum
creatinine concentration (mg/dl) between the groups. In the serum urea marker,
the control group had a higher mean compared to W2, W4 and TW2 (p = 0.0190), (p
= 0.0018) and (p = 0.0301) respectively. There was no difference between the TC
group and the other groups (p > 0.05). Likewise, groups TW2 and TW4 showed
no differences between them (p > 0.05)
Table III - Renal function estimation
equations, with results presented as mean and standard error
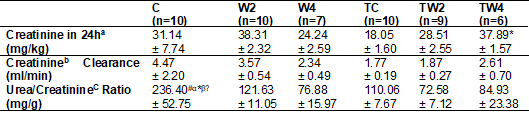
C = Sedentary control
not supplemented; W2 = Sedentary supplemented with 2 g kg-1 d-1;
W4 = Sedentary supplemented with 4 g kg-1 d-1; TC =
Trained not supplemented; TW2 = Trained supplemented with 2 g kg-1
d-1; TW4 = Trained supplemented with 4 g kg-1 d-1.
Two-Way post hoc Tukey ANOVA (intergroups): Symbols in the horizontal indicate
higher mean (p < 0.05) = # vs. W2; α vs. W4; * vs. TC; b vs. TW2; Ω vs. TW4. Equations: a = [Creatinine 24 h (mg/24h) /
Body Mass (kg); b = [Urinary Creatinine (mg/dl) x Volume (ml/24h) / Serum
Creatinine (mg/dl); c = [Serum Urea (mg/dl)/Serum Creatinine (mg/dL)
As shown in
table III, the 24-hour creatinine in mg/kg showed a significant difference
between the TW4 and TC groups, with TW4 higher than the TC (p = 0.0378). Groups
TW2 and TW4 showed no difference between them (p > 0.05) in relation to
24-hour creatinine relative to body mass. The control group and the TC group
showed no difference between them (p > 0.05). And there was no significant
difference in the creatinine clearance concentration (ml/min) between the
groups (p > 0.05). When the urea/creatinine ratio (mg/g) is observed, it is
noted that in the control group there is a higher concentration compared to the
groups W2 (p = 0.0373), W4 (p = 0.0031), TC (p = 0.0150), TW2 (p = 0.0008) and
TW4 (p = 0.0100). In this way, all groups showed a difference in relation to
the control. However, there was no difference between them (p > 0.05).
Discussion
In the present
study, it was exposed the changes in the creatinine and urea markers for the
doses of 2 g kg-1 d-1 and 4 g kg-1 d-1.
Previous studies have also used doses of whey proteins in an animal model,
mostly presenting lower doses than those presented. Haraguchi
et al. [23] investigated the influence of whey proteins on liver
enzymes, lipid profile and bone formation in hypercholesterolemic Fisher rats.
The serum creatinine concentration in the groups with whey protein and whey
protein hypercholesterolemic diets did not show any significant difference,
agreeing with our findings. Regarding the serum urea concentration, the results
were similar between the groups, differently from our results, since the
non-supplemented sedentary control group had a higher mean concentration
compared to W2, W4 and TW2. However, in our study, we did not use the
hypercholesterolemic diet, which may have generated a protective effect against
impaired renal function, as suggested by the authors [23].
The results
found by Athira et al. [24] when analyzing the
potential for improving the hydrolysate of whey proteins (WPH) against
oxidative stress induced by paracetamol in 24 mice showed like ours, since the
administration of WPH (4 mg/kg) significantly decreased the concentration of
creatinine serum. The reduction in serum creatinine values after
intraperitoneal and oral treatment with WPH established the antioxidant effect
in vivo. Therefore, it was concluded that WPH develops a protective effect
against impaired renal function induced by paracetamol [24].
Chen et al.
[25], when examining the improvement in exercise performance and biochemical
profiles in mice supplemented with whey proteins (dose of 4.1 g kg-1
d-1), did not identify significant differences in serum creatinine
between the supplemented and trained supplemented sedentary groups. However, it
is noteworthy that this study lasted 6 weeks, being, therefore, a shorter
period than the one adopted in our study. Lollo et
al. [26] investigated the effects of whey proteins (17% protein) and casein
plus leucine in trained Wistar rats, however, no clear changes in serum
creatinine values were detected, with no changes in this marker, like the
findings of the present study.
Franzen et
al. [27], in their chronic study with Wistar rats treated with low doses of
protein (10% whey in feed), found no significant differences between baseline
and end of treatment in any experimental group in relation to the values of
urea and serum creatinine. Therefore, no changes were observed in the values of
these markers, similarly to our findings in the serum creatinine marker and
diverging in the serum urea marker. We also emphasize that the dose adopted in
this finding was lower than the dose adopted in our study.
Santos et al.
[7], when researching the effects of dietary supplementation with a dose of 1.8
g/kg/day whey proteins sedentary Wistar rats, showed that no statistically
significant differences were found between the treated groups and the control
group for the values serum creatinine and urea, indicating that there was no
impairment of renal function. These results corroborate the findings in this
study, with no significant changes in serum creatinine values, however it
diverges as values in the concentration of serum urea. However, our study had a
considerably longer duration and dosage.
Khairallah et
al. [28] investigated the effect of diets containing 22.5 (g%) of protein
as milk protein isolate (MPI), whey protein isolate (WPI), soy protein isolate
(SPI), soy protein concentrate (SPC) and enzyme-treated soy protein (SPE) on
muscle function in 50 Sprague-Dawley rats. However, similarly to our study,
there were no significant differences in serum creatinine between groups at the
end of the study. Thus, there were no changes in the concentrations of this
marker. However, while our study lasted 12 weeks, this study administered the
diets for 8 weeks.
When we analyzed
the serum urea data, the results of this study showed a significant difference
between the sedentary control group and almost all supplemented groups, except
for only TW4, unlike the findings by Aparicio et al. [29] who did not
identify a significant difference in serum urea between groups when examining
the effects of whey proteins and soy protein intake on plasma renal parameters.
In turn, the
results presented by Aparicio et al. [30], when examining the effects of
consuming high doses of protein on renal parameters in rats, do not corroborate
our findings, since the groups with diets enriched with whey showed higher
values of serum urea compared with the groups with normoproteic
diet. Accordingly, Nebot et al. [31] who
examined the effects of the amount of diet and protein source on the bone
status of rats and the interactions that occur between these nutritional
factors, found higher values of serum urea in the groups with diets based on
whey proteins (45%) in comparison to the normoproteic
group. Although the findings differ from the results of this study, both serum
urea and serum creatinine values remain within the established reference range
[32,33,34].
In relation to
urinary biomarkers, we found in this study that the values of creatinine
(mg/dl) differ significantly in the TW2 and TW4 groups with the sedentary
control and trained control groups. Similarly, urea values (mg/dl) are
significantly different between groups TW2 and TW4 with sedentary control and
between TW2 and sedentary control. However, when we verified the results of
both 24-hour creatinine and 24-hour urea, no results were found with
significant differences between groups.
Finally, when we
analyzed the serum urea/creatinine ratio, we found significantly lower values
in the supplemented groups compared to the control group. However, again it was
not possible to make comparisons of these results with results from the
literature, because, unlike this study, in none of the studies that comprise
the systematic review calculated these variables, as well as the urinary
biomarkers.
In this way, the
importance of the findings is highlighted to contribute to the search for the
presence or absence of a protein threshold that can cause deleterious effects
on renal function, which can be indicated by changing the investigated
biomarkers.
However, it is
important to emphasize that some limitations of the present study must be
considered. Thus, additional studies should be carried out over a longer period
for this dose, as well as for higher doses to verify with precision if there is
a threshold in the dose of this substance that causes alterations and/or side
effects in the renal function of individuals healthy.
Conclusion
Considering the
results obtained in this study, it can be suggested that the treatment of male
Wistar rats with resistance training and supplementation with whey proteins at
doses of 2 g kg-1 d-1 and 4 g g
kg-1 d-1 for 12 weeks did not result in impairment of
renal function, as the values of serum biomarkers were within the ranges of
reference values. While urinary biomarkers, although showing significant
difference between groups, when normalized by the 24h urine volume (mg/24h),
all differences in creatinine and urea were normalized in mg/dl.
Acknowledgement
Our
thanks to the Physiology Laboratory (LEFISIO), in special to PhD Bruno Araújo
Serra Pinto; to the Histology Laboratory, on behalf of PhD Melaine
Mont Alverne Lawall Silva;
and to the members of the Physiology and Exercise Prescription Laboratory of Maranhão (LAFIPEMA).
Conflict
of interest
No
conflict of interest with relevant potential.
Financing
source
National
Council for Scientific and Technological Development (CNPq)
and Coordination for the Improvement of Higher Education Personnel (CAPES).
Author’s
contributions
Conception
and design of the research: Navarro F, Navarro AC, Silva AJS, Vieira EP. Data
collection, statistical analysis and writing of the manuscript: Vieira EP,
Silva AJS. Critical review of the manuscript: Vieira, EP. Navarro AC, Navarro
F. Publication of the document: Vieira EP, Navarro AC.
References
- Haraguchi FK,
Abreu WC, Paula H. Proteínas do soro do leite: composição, propriedades
nutricionais, aplicações no esporte e benefícios para a saúde humana. Rev Nutr 2006;19(4):479-88. doi: 10.1590/S1415-52732006000400007 [Crossref]
- Teba CD, Silva EMM, Chávez DWH, Carvalho CWP, Ascheri JLR. Effects of whey protein concentrate, feed moisture and temperature on the physicochemical characteristics of a rice-based extruded flour. Food Chem 2017;228:287-96. doi: 10.1016/j.foodchem.2017.01.145 [Crossref]
- Falkowski M, Maciejczyk M, Koprowicz T, Miko?u? B, Milewska A, Zalewska A, et al. Whey Protein concentrate WPC-80 improves antioxidant defense systems in the salivary glands of 14-month Wistar rats. Nutrientes 2018;10(6):782. doi: 10.3390/nu10060782 [Crossref]
- Nabuco HCG, Tomeleri CM, Sugihara Junior P, Fernandes RR, Cavalcante EF, Antunes M, et al. Effects of Whey protein supplementation pre- or post-resistance training on muscle mass, muscular strength, and functional capacity in pre-conditioned older women: a randomized clinical trial. Nutrientes 2018;10(15):563. doi: 10.3390/nu10050563 [Crossref]
- Cribb
PJ. US Whey proteins in sports nutrition. Applications Monograph Sports
Nutrition. US Dairy Export Council 2005 [Internet];4:1-12.
[cited 2020 Jan 15]. Available from:
http://wheyproteininstitute.org/sites/default/files/us-whey-proteins-in-sports-nutrition.pdf
- Díaz-Rúa R, Keijer J, Palou A, van Schothorst EM, Oliver P. Long-term intake of a high-protein diet increases liver triacylglycerol deposition pathways and hepatic signs of injury in rats. J Nutr Biochem 2017;46:39-48. doi: 10.1016/j.jnutbio.2017.04.008 [Crossref]
- Santos ACA, Martins MCC, Pereira LAC, Barros NS, Carvalho ML. Efeitos da suplementação alimentar com Whey Protein e leucina em ratos normais. J Health Sci 2016;18(2):121-8. doi: 10.17921/2447-8938.2016v18n2p121-128 [Crossref]
- Romão Junior J, Pinto SWL, Canziani ME, Praxedes JN, Santello JL, Moreira JCM. Censo SBN 2002: Informações epidemiológicas
das unidades de diálise do Brasil. J
Bras Nefrol 2003 [Internet];25(4):188-99. [cited 2020
Jan 15]. Available from:
https://bjnephrology.org/wp-content/uploads/2019/11/jbn_v25n4a04.pdf
- Silva EIV, Sousa LNC, Rocha AA.
Biomarcadores renais e sua importância no diagnóstico de nefropatias. Revista
Científica da FASETE 2017 [Internet];1:162-76. [cited 2020 Jan 15]. Available from:
https://www.unirios.edu.br/revistarios/media/revistas/2017/12/biomarcadores_renais_e_sua_importancia_no_diagnostico_de_nefropatias.pdf
- Dusse LMS, Rios DRA, Sousa LPN, Moraes RMMS, Domingueti CP, Gomes KB. Biomarcadores da função renal: do que dispomos atualmente? RBAC 2016;49(1):41-51. doi: 10.21877/2448-3877.201600427 [Crossref]
- Almeida, M.L. Dosagem de ureia e
creatinina em soro humano através da técnica de espectroscopia Raman comparada
com o método bioquímico [Dissertação]. São José dos Campos: Universidade Camilo
Castelo Branco; 2014. [Internet]. [cited 2020 Jan
15]. Available from:
https://sucupira.capes.gov.br/sucupira/public/consultas/coleta/trabalhoConclusao/viewTrabalhoConclusao.jsf?popup=true&id_trabalho=2254451
- Santesso N, Akl EA, Bianchi M, Mente A, Mustafa R, Heels-Ansdell D, Schünemann HJ. Effects of higher-versus lower-proteins diets on health outcomes: a systematic review and meta-analysis. Eur J Clin Nutr 2012;66(7):780-8. doi: 10.1038/ejcn.2012.37 [Crossref]
- Martin WF, Armstrong LE, Rodriguez NR. Dietary proteins intake and renal function. Nutr Metabol 2005;2:5. doi: 10.1186/1743-7075-2-25 [Crossref]
- Van Den Berg E, Hospers FA, Navis G, Engberink MF, Brink EJ, Geleijnsen JM, et al. Dietary acid load and rapid progression to endstage renal disease of diabetic nephropathy in Westernized South Asian people. J Nephrol 2011;24(1):11-7. doi: 10.5301/JN.2010.5711 [Crossref]
- Goraya N, Wesson DE. Dietary management of chronic kidney disease: Proteins restriction and beyond. Curr Opin Nephrol Hypertens 2012;21(6):635-40. doi: 10.1097/MNH.0b013e328357a69b [Crossref]
- SBCAL/CONCEA. Sociedade Brasileira de
Ciências em Animais de Laboratório: Diretriz brasileira para o cuidado e a
utilização de animais para fins científicos e didáticos. Brasília: Ministério
da Ciência Tecnologia e Inovação; 2013 [Internet]. [cited
2020 Jan 15]. Available from:
https://www.sbcal.org.br/conteudo/view?ID_CONTEUDO=65
- Leite RD, Durigan RCM, Lino ADS, Campos MVS, Souza MGS, Selistre-de-Araújo HS, et al. Resistance training may concomitantly benefit body composition, blood pressure and muscle MMP-2 activity on the left ventricle of high-fat fed diet rats. Metabolism 2013;62(10):1477-84. doi: 10.1016/j.metabol.2013.05.009 [Crossref]
- Hornberger TAJR, Farrar RP. Physiological hypertrophy of the FHL muscle following 8 weeks of progressive resistance exercise in the rat. Can J Appl Physiol 2004;29(1):16-31. doi: 10.1139/h04-002 [Crossref]
- Andersen
ML, D’almeida V, Ko GM, Kawakami R, Martins PJF. Procedimentos
experimentais. In: Andersen ML, D’almeida V, Ko GM, Kawakami R, Martins PJF. Princípios éticos e práticos do
uso de animais de experimentação. Departamento de Psicobiologia. São Paulo:
Escola Paulista de Medicina. Universidade Federal de São Paulo; 2004.
- Leary
S, Underwood W, Anthony R, Cartner S, Corey D,
Grandin T, et al. AVMA Guidelines for the euthanasia of animals. American
Veterinary Medical Association. Version ; 2020
[Internet]. [cited 2021 Apr
2]. Available from:
https://www.avma.org/sites/default/files/2020-01/2020-Euthanasia-Final-1-17-20.pdf
- CONCEA. Conselho Nacional de Controle de
Experimentação Animal: Resolução normativa n°25 de 29 de setembro de 2015.
Brasília: Ministério da Ciência Tecnologia e Inovação; 2015 [Internet]. [cited 2020 Jan 15]. Available from:
https://www.in.gov.br/materia/-/asset_publisher/Kujrw0TZC2Mb/content/id/33252781/do1-2015-10-02-resolucao-normativa-n-25-de-29-de-setembro-de-2015-33252777
- Togashi Y, Miyamoto Y. Urinary cystatin C as a biomarker for diabetic nephropathy and its immunohistochemical localization in kidney in Zucker diabetic fatty (ZDF) rats. Exp Toxicol Pathol 2013;65(5):615-22. doi: 10.1016/j.etp.2012.06.005 [Crossref]
- Haraguchi FK, Pedrosa ML, Paula H, Santos RC, Silva ME. Influência das proteínas do soro sobre enzimas hepáticas, perfil lipídico e formação óssea de ratos hipercolesterolêmicos. Rev Nutr 2009;22(4):517-25. doi: 10.1590/S1415-52732009000400007 [Crossref]
- Athira
S, Mann B, Sharma R, Kumar R. Ameliorative potential of whey protein
hydrolysate against paracetamol-induced oxidative stress. J Dairy Sci
2013;96(3):1431-37. doi: 10.3168/jds.2012-6080 [Crossref]
- Chen
WC, Wen-Ching H, Chien-Chao C, Yu-Kai C, Chi-Chang H.
Whey protein improves exercise performance and biochemical profiles in trained
mice. Med Sci Sports Exerc 2014;250:1518-24.
doi: 10.1249/MSS.0000000000000272 [Crossref]
- Lollo PCB, Silva LBC, Batista TM, Morato PN, Moura CS, Cruz AG, et al. Effects of whey protein and casein plus leucine on diaphragm the mTOR pathway of sedentary, trained rats. Food Research International 2012;49:416-24. doi: 10.1016/j.foodres.2012.07.024 [Crossref]
- Franzen
JM, Vaz JG, Zancanaro V, Bitencourt RM. Baixa dose de whey protein reduz glicose, triglicérides e controla o peso
corporal em ratos wistar. Revista Brasileira de
Obesidade, Nutrição e Emagrecimento 2016 [Internet];10(57):133-44. [cited 2020 Jan 15]. Available from: http://www.rbone.com.br/index.php/rbone/article/view/425
- Khairallah RJ, O'shea KM, Ward CW, Butteiger DN, Mukherjea R, Krul ES. Chronic dietary supplementation with soy protein
improves muscle function in rats. PLoS One
2017;12(12):1-13. doi: 10.1371/journal.pone.0189246 [Crossref]
- Aparicio VA, Nebot E, Tassi M, Camiletti-Moirón D, Sanchez-Gonzalez C, Porres JM, et al. Whey versus soy protein diets and renal status in rats. J Med Food 2014;17(9):1011-16. doi: 10.1089/jmf.2013.0117 [Crossref]
- Aparicio VA, Nebot E, Kapravelou G, Sánchez C,
Porres JM, López Jurado M, et al. El entrenamiento de
fuerza reduce la acidosis metabólica y la hipertrofia hepática y renal consecuentes
del consumo de una dieta hiperproteica
en ratas. Nutr
Hosp 2011 [Internet];26(6):1478-86. [cited 2020 Jan 15]. Available from:
http://scielo.isciii.es/scielo.php?script=sci_arttext&pid=S0212-16112011000600040
- Nebot
E, Erben RG, Porres JM, Femia P, Camiletti-Moirón D,
Aranda P, et al. Effects of the amount and source of dietary protein on bone
status in rats. Food Funct
2014;5(4):716-23. doi: 10.1039/c3fo60525f [Crossref]
- Dantas JA, Ambiel CR, Cuman RKN, Baroni S, Bersani-Amado CA. Valores de referência de alguns parâmetros fisiológicos de ratos do Biotério Central da Universidade Estadual de Maringá, Estado do Paraná. Acta Sci. Health Sci 2006;28(2):165-170. doi: 10.4025/actascihealthsci.v28i2.1099 [Crossref]
- Lima CM, Lima AK, Melo MGD, Dória GAA,
Leite BLS, Serafini MR, et al. Valores de referência
hematológicos e bioquímicos de ratos (Rattus novergicus linhagem Wistar)
provenientes do biotério da Universidade Tiradentes. Scientia Plena 2014 [Internet];10(3):1-9. [cited 2020
Jan 15]. Available from: https://www.scientiaplena.org.br/sp/article/view/494
- Torres LV, Rodrigues DHA, Carlos LE,
Sarmento TAB, Abrantes VEF. Padronização dos valores de referência de
marcadores hepáticos e renais em ratos fêmeas da linhagem Wistar
provenientes do biotério da Faculdade Santa Maria. Revista Interdisciplinar em
Saúde 2017 [Internet];4(1):171-9. [cited 2020 Jan
15]. Available from:
http://interdisciplinaremsaude.com.br/Volume_14/Trabalho_13.pdf