Rev Bras Fisiol Exerc 2021;20(2):200-211
doi: 10.33233/rbfex.v20i2.4313
ORIGINAL ARTICLE
Relationship between functional movement screen and
physical performance in elite young soccer players
Relação entre a avaliação funcional do movimento e
performance física em jovens atletas de elite do futebol
Diêgo
Augusto Nascimento Santos, Fabio Garcia Madalen Eiras,
Deborah Touguinhó Gonet,
Maria Juliana de Almeida Robalinho, Fabrício Vieira do Amaral Vasconcelos
Universidade
do Estado do Rio de Janeiro, Brazil
Received:
July 29, 2020; Accepted: March
25, 2021.
Correspondence: Fabrício Vieira do Amaral Vasconcelos, Rua São Francisco
Xavier, 524 sala 8133 bloco F, 20550-900 Rio de
Janeiro RJ
Diêgo Augusto Nascimento
Santos: diegoaugustoufs@gmail.com
Fabio Garcia Madalen Eiras:
fabio-eiras@hotmail.com
Deborah Touguinhó Gonet: deborahtouguinho@gmail.com
Maria Juliana de Almeida Robalinho:
mariarobalinho@gmail.com
Fabrício Vieira do Amaral Vasconcelos:
fabricio.vasconcellos@uerj.br
Abstract
Background: Soccer
performance can be analyzed by different physical parameters such as linear
speed and power. In addition, movement quality evaluations are used to assess
individual functional capacity and a widely used tool is the functional
movement screen (FMS). Objectives: The present study had three aims: 1) analyse the association of FMS final score and individual
FMS scores with peak and relative muscle power and 10-m and 30-m sprints of
young soccer players; 2) analyse the association
between muscle power and speed from different categories controlled by FMS
score; 3) compare peak and relative muscle power and 10-m and 30-m sprints
between athletes with results of FMS >14 and < 14 scores in different
categories. Methods: Fifty-six Brazilian players from U15, U17, and U20
participated in the research. Subjects performed anthropometric measurements,
FMS, muscle power, and 10-m, and 30-m sprint. Results: The results
showed no association between FMS score and muscle power and speed (p >
0.05). However, stability-push-up showed small association with peak and
relative muscle power (r = 0.28, p < 0.05; r = 0.29, p < 0.05,
respectively). The in-line-lunge test showed inverse and small correlation with
10-m sprint (r = -0.28; p < 0.05). Relationship between peak and relative
muscle power with 10-m and 30-m sprints showed moderate and small association
in all categories, respectively (r = -0.76-0.32, p = 0.01). In addition, it was
not found difference among players above and below 14 score. Conclusion:
Based on these findings, the 14 score shows to be a weak cut-off value and it
can be assumed that there are no association between FMS and power and speed in
youth soccer.
Keywords: athletic performance; physical
functional performance; athletes; physical fitness; soccer.
Resumo
Introdução: A performance no futebol pode ser
analisada por diferentes parâmetros físicos como velocidade linear e potência.
Além disso, a avaliação da qualidade de movimento é utilizada para verificar a
capacidade funcional individual e uma ferramenta bastante utilizada é a
avaliação funcional do movimento (FMS - Functional
Movement Screen). Objectives:
O presente estudo teve três objetivos: 1) analisar a relação da pontuação final
e individual do FMS com a potência muscular e velocidade em jovens jogadores de
futebol; 2) analisar a relação da potência muscular com a velocidade,
controlada pela pontuação do FMS, de diferentes categorias; 3) comparar
potência muscular e velocidade entre os atletas de diferentes categorias com
pontuação do FMS <14 e >14. Métodos: Participaram 56 jogadores
brasileiros (Sub-15, Sub-17 e Sub-20). Os atletas realizaram medidas
antropométricas, FMS, teste de potência muscular e velocidade. Resultados:
Os resultados mostraram que não houve correlação entre a pontuação do FMS e
potência muscular e velocidade (p > 0,05). Entretanto, a flexão de braço
mostrou uma correlação pequena com potência muscular máxima e relativa (r =
0,28, p < 0,05; r = 0,29, p < 0,05, respectivamente). O agachamento
unilateral mostrou uma correlação pequena e inversa com sprint de 10 m (r =
-0,28; p < 0,05). A relação entre potência muscular com sprints de 10 e 30 m
mostrou uma correlação moderada e pequena, respectivamente, em todas as
categorias (r = -0,76-0,32, p = 0,01). Além disso, não foi encontrada diferença
entre os jogadores que apresentaram valores abaixo e acima de 14. Conclusão:
Baseado nos achados, a pontuação 14 no FMS parece ser um fraco valor de corte,
assim como parece não haver relação do FMS com potência e velocidade em jovens
jogadores de futebol.
Palavras-chave: desempenho atlético; desempenho físico
funcional; atletas; aptidão física; futebol.
Introduction
Soccer is
considered an intermittent energy-intensive sport, predominantly involving the
aerobic system [1,2,3,4]. However, the moments that determine the soccer game are
characterized by strength, power, change of direction and speed actions, also
demonstrating great importance of the anaerobic system in this sport [5]. Thus,
evaluating and developing these core skills is necessary to promote the high
level of performance for players [6]. In addition, in recent years, the
interest of researchers and coaches in assessing and improving the athlete's
functional capacity has grown and it is considered extremely important to
improve the athletes' performance [7,8].
Soccer
performance assessment is based on different parameters and it could include
linear speed tests, change of direction, lower limb muscle power, anaerobic capacity and strength [9,10]. Studies about performance have
shown associations between lower limb muscle power assessment in linear
transducer and speed in sprint test in different modalities [11,12]. In recent
years, new technologies have been used to measure muscle power in elite
athletes, and one example is device with pneumatics resistance. This technology
allows great resemblance to sports gestures since resistance always remains
constant during movement [13,14]. This pneumatic resistance characteristic can
explain why have been increasing the number of studies with this procedure to
evaluate power in soccer [15]. Nevertheless, the number of researches
that associate squat and pneumatic resistance and speed in soccer players is
limited.
Moreover,
observe the athlete's ability to perform basic movement patterns have also been
used as part of performance evaluation, and for some authors, it is related
with high performance in sprints and muscle power movements [16,17]. Thus, some
studies have suggested the use of the functional movement screen (FMS) as a
simple tool that evaluates common movement patterns in sports [16,18]. The FMS
is an assessment created by Cook et al. [19,20] to measure the individual
functional capacity of athletes. The tool consists of performing seven
fundamental human movement patterns that require mobility, stability and motor
control and its score ranges from 0 to 21 points. The literature has suggested
that a final score <14 is a cut-off value to correlate with increased risk
of injury [21]. However, some recent studies have shown that there is not
always a relation between FMS score and risk of injury [22,23]. Although many
studies have shown moderate-reliability values [22], FMS is a low-cost method
and therefore accessible to many teams. Several clubs in the major leagues all
around the world continue to use this tool as part of the athletes' assessment,
which justifies further research not only to associate the FMS with the risk of
injury but also with sports performance.
Few studies have
searched associations between FMS final score and performance variables in
soccer athletes [16,18,24]. Lee et al. [24] verified that FMS score
could affect speed and agility of elite male collegiate soccer players and
Lloyd et al. [18] found moderate and high correlation between FMS total
score and strength, power and agility in young soccer
athletes. However, Silva et al. [16] did not demonstrate a relation
between FMS total score and performance variables, although the authors
presented small associations with FMS individual scores in U-16 and U-19.
Besides soccer, studies with other sports and non-athletes also showed
inconclusive results regarding associations between FMS score and squat jump,
agility, strength, and anaerobic capacity. One of the reasons for this
inconclusion can be the different variables and distinct performance tests in
studies [16,18,24]. Moreover, none studies until the moment have used pneumatic
equipment to assess muscle power and to associate it with movement pattern and
FMS individual scores.
Therefore,
further studies are needed to observe the correlations of FMS with performance
parameters in young soccer players. In this context, the present study has
three aims: 1) analyze the association of FMS final score and individual FMS
scores with peak and relative muscle power and 10-m and 30-m sprints of young
soccer players; 2) analyze the association between muscle power and speed from
different categories controlled by FMS score; 3) compare peak and relative
muscle power and 10-m and 30-sprints between athletes with results of FMS >
14 and < 14 in different categories. The assumption is that there is a small
association between the result of the FMS and performance variables and FMS
score is expected to improve the power and speed association. In addition, it
is not supposed to have difference between athletes with results of FMS >14
and <14.
Methods
The present
cross-sectional study aimed to examine the associations between movement
pattern with lower limb muscle power and 10- and 30-meters sprints of young
soccer athletes of different categories. The subjects performed all tests on
the same day, in the following order: 1) anthropometric measurements; 2)
functional movement screen (FMS); 3) Muscle power; 4) 10-m and 30-m sprints.
The subjects were familiar with the tests and they were instructed as to the
procedure. After completing the FMS, the athletes performed a 5-min general
warm-up on a cycle ergometer and subsequently they were conducted to the lower
limb muscle power and speed tests, respectively. It was observed a 15-minute
rest interval between each test, and all evaluations took place between 9:00
a.m. and 1:00 p.m.
The sample
consisted of 56 young Brazilian soccer players from an elite club, divided into
U15, U17, and U20 (N = 9, 29 and 18, respectively). Inclusion criteria were, a)
to be in the club for at least 6 months; b) not having suffered injuries in the
last 3 months and as exclusion criteria was considered not to complete the test
battery. The athletes were in the club's pre-season and individual interviews
were conducted explaining the importance of the assessment, subsequently, all
players signed the informed consent form in accordance with the Declaration of
Helsinki. All players were familiar with the physical testing procedures and
requirements. The research was approved on 22 July 2016 by the ethics committee
of the Universidade do Estado do Rio de Janeiro
under the responsibility of Lucas Ometto with the
protocol number 1645377.
Anthropometrics
Body mass and
height were measured according to standard procedures (Lohman, 1986). Body mass
was assessed with a digital scale (Filizola TM, SaoPaulo, SP, Brazil) and height with a fixed stadiometer (Sanny TM, São Paulo, SP, Brazil).
Functional movement screen
FMS is a
subjective analysis tool based on the evaluation of fundamental movement
patterns, according to seven standards: deep squat, hurdle step, in line lunge,
shoulder mobility, active straight leg raises, trunk stability push-up, and
rotary stability. Three repetitions were performed and the best one was used
for analysis, the evaluated patterns followed in a scale from 0 to 3,
represented according to the criteria. Score 3: achievement of perfect motion,
without compensations, meeting the movement expectations of the pattern
associated with each test. Score 2: complete the movement but using standard
motion compensations. Score 1: the subject is unable to perform the movement
pattern or unable to assume the starting position to perform the movement.
Score 0: the individual feels pain when performing the movement. The subjects
returned the starting position between each attempt and at the end, the maximum
score could reach 21 points. Except for deep squat and trunk stability push-up,
all movements were evaluated bilaterally. The FMS was applied by a certified
evaluator with two years of experience. After obtaining the final score, the
athletes were divided into two groups, group with score <14 and group with
score >14 [19,20].
10-m and 30-m Sprints
The athletes
performed two submaximal 30-m sprints attempts. After an interval of 5 minutes,
they started the test in the stationary position and completed two maximum 30-m
sprints attempts with a 60-second interval between them. Three pairs of
photocells (Brower Timing Systems, USA) were used at positions 0-m, 10-m and
30-m. Players were instructed to run as fast as possible until they exceeded
the final photocell pair, the best attempt was considered for analysis.
Squat power pneumatic test
It was used the
Keiser Air 300Squat Machine (Keiser, Fresno, USA) to determine peak power,
which is a pneumatic strength and power measurement machine. The consisted
warm-up performed included 5 minutes of cycling at 50W on a cycle ergometer,
followed by 10 squats at 40% of the athletes’ body mass. Participants were
instructed to position themselves on the equipment with their feet hip-width
apart and to place their hands on the equipment rod, afterwards the resistance
was placed on both shoulders. Players started the test from the standing position and they were instructed to perform a finding up to
the 90º squat position (measured with a digital goniometer – Global Medical
Devices; Maharashtra, India), maintaining for 3 seconds, and afterward a
complete extension at the maximum concentric speed of the knees, hip, and
ankle, triple extension movement. Everyone started with a load equivalent to
100% of body weight. An ultrasonic system mounted on the pneumatic cylinder is
responsible for printing charge to motion and monitoring relative motion over
time, allowing the calculation of distance and speed, therefore work and power.
These values are displayed on a configurable digital display [14].
Subsequently, the relative power was calculated using the power peak divided by
the bodyweight of each athlete.
Statistical analysis
Data were
presented as mean ± standard deviation. Sample normality was analyzed using the
Kolmogorov Smirnov test. Student's t-test for independent samples was used for
comparisons within the groups (FMS > 14 vs FMS < 14). Pearson's
product-moment correlation coefficient was used to determine associations
between FMS scores, peak power, relative power, and 10m and 30m sprints and
partial correlation was used to determine associations between FMS score and
power in sprint. It was used Hedges’ g to measure effect size, considering
insignificant (< 0.19), small (0.20-0.49), medium (0.50-0.79), large
(0.80-1.29) and very large (> 1.30) [25]. The significance level adopted was
p < 0.05 and the analyses were performed using IBM SPSS for Windows version
25.0.
Results
Table I shows
descriptive statistics regarding physical variables. Table II shows the
correlation values between the individual scores and the total FMS and the
performance variables. It was found a small and inverse correlation between in
line lunge and 10-m Sprint (r = -0.28; p = 0.03), also small correlations were
observed between trunk stability push-up tests and power: peak (r = 0.28; p =
0.03) and relative (r = 0.29; p = 0.03).
Table I - Descriptive statistics (mean
± SD) of physical variables
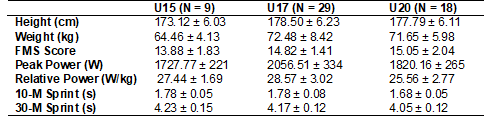
Table II - Correlation between
individual function movement screen scores and performance variables for all
categories
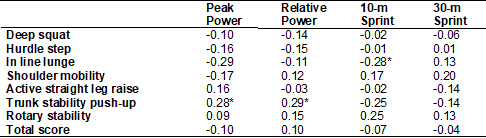
*Correlation was
significant at level 0.05; **Correlation was significant at level 0.01.
Table III shows
the associations between peak and relative power with the 10-m and 30-m sprints
for different categories. For U15 athletes, a moderate and inverse association
was observed between peak power and 30-m sprint (r = -0.76; p = 0.01). For U17
athletes, small and moderate associations were observed between peak power and
10-m and 30-m sprints (r = -0.37; p = 0.04; r = -0.55; p < 0.01,
respectively) and relative power with 10-m and 30-m sprints (r = -0.42; p =
0.02; r = -0.56; p < 0.01, respectively). Regarding the U20 athletes, it
showed moderate and inverse associations between peak power (r = -0.54; p =
0.02) and relative power (r = -0.62; p < 0, 01) with the 10-m sprint. When
all categories were observed, there was only a small and inverse correlation
between peak power and 30-m sprint (r = -0.32; p = 0.05).
Table III – Correlation between power and
sprint for different distance
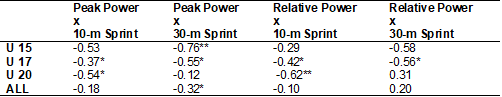
*Correlation
was significant at level 0.05; **Correlation was significant at level 0.01.
Table IV shows
the partial correlations between peak and relative power with 10-m and 30-m
sprints controlled by FMS final score for different categories. Regarding the
associations between peak power and 10-m and 30-m sprints in the U15 and U17, inverse
and moderate correlations were observed (r = -0.77, p = 0.02; r = - 0.54, p
< 0.01, respectively). For the U20, there was a moderate and inverse
correlation between peak power and the 10-m sprint (r = -0.56; p = 0.02). When
all players were analysed, a small association was
found between peak power and 30-m sprint (r = -0.32; p = 0.01). According to
the associations between relative power and the 30-m sprint, only a moderate
and inverse correlation was observed in U17 category (r = -0.52; p > 0.01) and
associations between relative power and the 10-m sprint in U20 (r = -0.63; p
> 0.01). When all athletes were analysed
no relationships were found.
Table IV - Correlation between power and
sprint controlled by functional movement screen final score
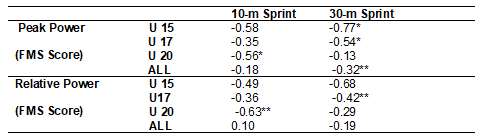
*Correlation
was significant at level 0.05; **Correlation was significant at level 0.01
Figure 1 shows
the intra-group comparisons for performance variables involving different
categories. No significant differences were observed when comparing athletes
with FMS < 14 and > 14 in U15 category (peak power: p = 0.98, t = -0.01,
g = 0.009; relative power: p = 0.98, t = -0.02, g = 0.016; 10-m sprint: p =
0.15, t = -1.58, g = 0.994; 30-m sprint: p = 0.40, t = -0.89, g = 0.565), U17
category (peak power: p = 0.64, t = -0.47, g = 0.172; relative power: p = 0.12,
t = -1.59, g = 0.578; 10-m sprint: p = 0.39, t = -0.13, g = 0.315; 30-m sprint:
p = 0.14, t = -0.170, g = 0.539), U20 category (peak power: p = 0.92, t =
-0.09, g = 0.043; relative power: p = 0.96, t = 0.04, g = 0.020; 10-m sprint: p
= 0.69, t = -0,40, g = 0.184; 30-m sprint: p = 0.38, t = -0.89, g = 0.401).
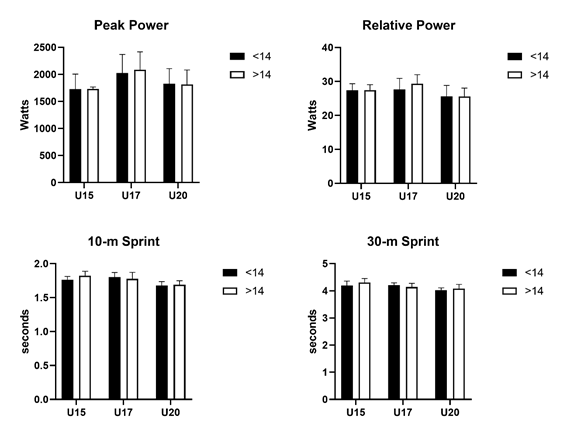
Figure 1 - Comparison of performance
variables of U15, U17 and, U20 categories for groups of athletes with FMS
<14 and >14
Discussion
The present
study aimed to verify the relationship between FMS scores and performance
variables in young elite soccer players of different categories. The main
findings of this study are: trunk stability push-up
presented small association with power capacity, as well as in line lunge with
10-m sprint. Peak power and 10-m sprint relationship were small in U17 and
moderate in U20 players, and peak power relation with 30-m sprint were moderate
in U15 and U17 players. Furthermore, moderate association were observed between
relative power and 10-m and 30-m sprints in U17 and U20 players. In addition,
the association was small when gathered the categories and FMS score did not
change the relation between power and speed. Moreover, no differences were
found in performance variables among athletes with FMS <14 and >14.
Regarding the
individual FMS tests, trunk stability evaluated by Push-up and in line lunge
showed a small relationship with the physical variables such as peak power,
relative power, and speed in 10-m. These results can be explained by the fact
that short distance speed (sprint 10 m) is highly related to quickly high force
production (force development rate) in a horizontal direction vector. Although
the in line lunge evaluates force on one leg, the
vector is in the vertical direction, which may justify the small correlation
[26,27]. A study of young soccer players showed that the morphology of the
lumbar square and spine erector muscles both located on the trunk were a
determining factor for improved sprinting ability over short distances [28].
This association can be explained mainly in short distances, acceleration
phase, where athletes need to move the trunk forward to facilitate propulsion,
according to electromyographic analysis, at these angles, there is high
activation of the lumbar muscles [29,30]. Moreover, the present study found a
small correlation (r = -0.28, p = 0.03) of in line lunge with 10-m sprint,
although the small relationship, this movement pattern requires good upper body
stability and strength of lower limbs in single-foot to support body weight
[31].
Observing the
relationship between physical variables and the final score of the FMS may be a
way to notice associations between functional capacity and athletes' physical
performance. The results found in this study corroborate previous studies with
young soccer players which showed no associations between FMS final score and
countermovement jump and squat jump [16,31]. The poor relation between FMS and
performance in the analyzed variables can also be explained by the fact that in
FMS it is necessary to obtain large ranges of motion and quality in movement,
however in performance tests only the result is considered, not considering the
movement quality. For example, in the deep squat test is required far range of
motion and to keep the torso straight, but in the high-speed sprint for better
acceleration in the early stages of the running, the athlete's torso need to be
inclined projecting the center of mass [32].
The present
research showed small association between power in pneumatic machine and speed
while considered all categories. According to recent studies, improving the
ability to generate lower limb power may be an effective way to promote speed
increases in athletes [33,34]. It was expected that a relationship between peak
power and speed within 10 meters would be found, as the ability to generate
maximum force in a short time could assist in the body's removal of inertia at
the start of the run and consequently increase acceleration [33]. Nevertheless,
this result may have occurred since for some soccer athletes, the time to cover
10 m is not sufficient to develop the maximum power to accelerate the running
[35]. Yet peak power and 30-m sprint presented moderate association in U15 and
U17 categories, no association were found in U20 category. This can be
explained by the different categories, the younger athletes may have a greater
need for power to gain speed, owing to skills such as coordination, stretching
and shortening cycle may not yet be developed [36].
The correlations
of lower limb power controlled by FMS score and speed either at 10-m or at 30-m
were unable to increase association. Thus, the levels of movement patterns in
athletes did not change this relationship between power and speed. However, the
good movement patterns in specific skills can reduce asymmetries by favoring
muscle synergy and it can also expose athletes to lower injury risk factors
which increases players competitive time [37]. The adequate usage of limb power
to improve acceleration is explained by the ability to perform motions with a
balance between mobility and stability along the kinetic chain, which prevents
energy dissipation, favoring skill accuracy [31]. Regarding comparisons
involving athletes with FMS scores < 14 and > 14, there was no difference
for any physical variable analysed in the present
study, for all categories. These outcomes corroborate the findings in the
current literature that show that the value of 14 in FMS result cannot be
considered a good parameter to discriminate athletes [23].
The study has
some limitations: 1) initially, the maturational state of the athletes was not
considered, which might interfere in physical performance; 2) second, lower
limb power rating used load with arbitrary values. Nevertheless, the study has
some strengths: 1) it is the first study to use the relationship between power
and speed using pneumatic machines; 2) the sample has athletes from different
categories. Therefore, these conclusions can assist coaches to plan training
sessions for direct the development of relevant aspects to improve athletes'
performance and suggesting coaches seek strategies to assess movement patterns
of specific skills. Moreover, future research should be performed using power
tests that use the individual's loads for understand the power x speed profile,
plus a longitudinal study to see if young athletes who have lower FMS scores
suffer a greater number of injuries over time. In addition, new researches must observe cut off points of FMS score
considering the characteristics of the studied sample.
Conclusion
Based on the
findings of the present study, it can be assumed that there are no association
between FMS final score and physical variables in youth soccer athletes.
However, trunk stability and in line lunge assessed by FMS have demonstrated a
small association with performance. Moreover, relationship between power in
pneumatic test and speed were moderate and this relation did not change when
controlled by FMS score. In addition, the score of 14 in FMS shows to be a weak
cut-off value, as it did not show differences in the physical variables.
Conflict of interest
The authors have no
conflict of interest directly relevant to the contents of this article.
Funding
This research was
partially supported by grants from the Carlos Chagas Filho Foundation for the
Research Support in Rio de Janeiro State and Brazilian Council for the
Technological and Scientific Development and was financed in part by the Coordenação de Aperfeiçoamento Pessoal de Nivel Superior–Brasil
(CAPES)–Finance Code 001
Authors’ contribution
Diêgo Augusto was responsible for developing the research problem and writing
the article. Fabio Eiras performed the data
collection. Deborah Touguinhó and Maria Juliana assisted
in writing. Fabrício Vasconcellos guided the whole
process.
References
- Bangsbo J.
Energy demands in competitive soccer. J Sports Sci 1994;12:5-12.
doi: 10.1080/02640414.1994.12059272 [Crossref]
- Bangsbo J, Iaia F, Krustrup P. Metabolic response and fatigue in soccer. Int J Sports Physiol Perform 2007;2(2):111-27. doi: 10.1123/ijspp.2.2.111 [Crossref]
- Bangsbo J, Mohr M, Krustrup P. Physical and metabolic demands of training and match-play in the elite football player. J Sports Sci 2006;24:665-74. doi: 10.1080/02640410500482529 [Crossref]
- Krustrup P,
Mohr M, Steensberg A, Bencke
J, Kjaer M, Bangsbo J. Muscle and blood metabolites during a soccer game:
implications for sprint performance.
- Faude O, Koch T, Meyer T. Straight sprinting is the most frequent action in goal situations in professional football. J Sports Sci 2012;30(7):625-31. doi: 10.1080/02640414.2012.665940 [Crossref]
- Kobal R, Loturco I, Barroso R, Gil S, Cuniyochi Rr, Ugrinowitsch C, et al. Effects of different combinations of strength, power, and plyometric training on the physical performance of elite young soccer players. J Strength Cond Res 2017;31(6):1468-76. doi: 10.1519/JSC.0000000000001609 [Crossref]
- Bennett H, Davison K, Arnold J, Slattery F, Martin M, Norton K. Multicomponent musculoskeletal movement assessment tools: a systematic review and critical appraisal of their development and applicability to professional practice. J Strength Cond Res 2017;31(10):2903-19. doi: 10.1519/JSC.0000000000002058 [Crossref]
- Campa F, Spiga F, Toselli S. The effect of a 20-week corrective exercise program on functional movement patterns in youth elite male soccer players. J Sport Rehabil 2019;28(7):746-51. doi: 10.1123/jsr.2018-0039 [Crossref]
- Walker S, Turner A. A one-day field test battery for the assessment of aerobic capacity, anaerobic capacity, speed, and agility of soccer players. J Strength Cond Res 2009;31(6):52-60. doi: 10.1519/SSC.0b013e3181c22085 [Crossref]
- Hulse MA, Morris JG, Hawkins RD, Hodson A, Nevill AM, Nevill ME. A field-test battery for elite, young soccer players. Int J Sports Exerc Med 2013;34(04):302-11. doi: 10.1055/s-0032-1312603 [Crossref]
- Loturco
I, D'Angelo RA, Fernandes V, Gil S, Kobal R, Abad CCC, et al. Relationship
between sprint ability and loaded/unloaded jump tests in elite sprinters. J Strength Cond Res 2015;29(3):758-64. doi:
10.1519/JSC.0000000000000660 [Crossref]
- Zabaloy S, Carlos-Vivas J, Freitas TsT, Pareja-Blanco F, Pereira L, Loturco I, et al. Relationships between resisted sprint performance and different strength and power measures in rugby players. Sports 2020;8(3):34. doi: 10.3390/sports8030034 [Crossref]
- Frost DM, Cronin JB, Newton RU. A comparison of the kinematics, kinetics and muscle activity between pneumatic and free weight resistance. Eur J Appl Physiol 2008;104(6):937-56. doi: 10.1007/s00421-008-0821-8 [Crossref]
- Frost DM, Bronson S, Cronin JB, Newton RU. Changes in maximal strength, velocity, and power after 8 weeks of training with pneumatic or free weight resistance. J Strength Cond Res 2016;30(4):934-44. doi: 10.1519/JSC.0000000000001179 [Crossref]
- Maior A. Absolute and relative peak power during pneumatic squat exercise using different percentages of loads in elite soccer players. Hum Mov 2020;21(3):64-70. doi: 10.5114/hm.2020.91347 [Crossref]
- Silva B, Clemente FM, Camões M, Bezerra P. Functional movement screen scores and physical performance among youth elite soccer players. Sports 2017;5(1):16. doi: 10.3390/sports5010016 [Crossref]
- Silva B, Clemente FM, Martins FM. Associations between functional movement screen scores and performance variables in surf athletes. J Sports Med Phys Fitness 2018;58(5):583-90. doi: 10.23736/S0022-4707.17.07154-7 [Crossref]
- Lloyd RS, Oliver JL, Radnor JM, Rhodes BC, Faigenbaum AD, Myer GD. Relationships between functional movement screen scores, maturation and physical performance in young soccer players. J Sports Sci 2015;33(1):11-9. doi: 10.1080/02640414.2014.918642 [Crossref]
- Cook G, Burton L, Hoogenboom
B. Pre-participation screening: the use of fundamental movements as an
assessment of function-part 1. N Am J Sports Phys Ther
[Internet] 2006;1(2):62-72. [citado 2021 May 10]. Available from: https://www.ncbi.nlm.nih.gov/pmc/articles/PMC2953313/
- Cook G, Burton L, Hoogenboom
B. Pre-participation screening: the use of fundamental movements as an
assessment of function-part 2. N Am J Sports Phys Ther [Internet]
2006;1(3):132-9. [citado 2021 May 10]. Available from: https://www.ncbi.nlm.nih.gov/pmc/articles/PMC2953359/
- Hammes D, Funten K Aus der, Bizzini M, Meyer T. Injury prediction in veteran football players using the Functional Movement Screen™. J Sports Sci 2016;34(14):1371-9. doi: 10.1080/02640414.2016.1152390 [Crossref]
- Cuchna JW, Hoch MC, Hoch JM. The interrater and intrarater reliability of the functional movement screen: a systematic review with meta-analysis. Phys Ther Sport 2016;19:57-65. doi: 10.1016/j.ptsp.2015.12.002 [Crossref]
- Moore E, Chalmers S, Milanese S, Fuller JT. Factors influencing the relationship between the functional movement screen and injury risk in sporting populations: a systematic review and meta-analysis. Sports Med 2019:1-15. doi: 10.1007/s40279-019-01126-5 [Crossref]
- Lee S, Kim H, Kim J. The functional movement screen total score and physical performance in elite male collegiate soccer players. J Exerc Rehabil 2019;15(5):657-62. doi: 10.12965/jer.1938422.211 [Crossref]
- Cohen J. Statistical power analysis for the behavioral sciences. 2ª ed. Hillsdale: Erbaum Press; 1988. doi: 10.4324/9780203771587 [Crossref]
- Bezodis NE,
North JS, Razavet JL. Alterations to the orientation
of the ground reaction force vector affect sprint acceleration performance in
team sports athletes. J Sports Sci 2017;35(18):1817–24. doi:
10.1080/02640414.2016.1239024 [Crossref]
- Hicks DS, Schuster JG, Samozino
P, Morin J-B. Improving mechanical effectiveness during sprint acceleration:
practical recommendations and guidelines. Strength Cond J 2019;1. doi:
10.1519/SSC.0000000000000519 [Crossref]
- Kubo T, Hoshikawa Y, Muramatsu M, Iida T, Komori S, Shibukawa K, et al. Contribution of trunk muscularity on sprint run. Int J Sports Med 2011;32(03):223-8. doi: 10.1055/s-0030-1268502 [Crossref]
- Thorstensson ALF, Carlson H, Zomlefer MR, Nilsson J. Lumbar back muscle activity in relation to trunk movements during locomotion in man. Acta Physiol Scand 1982;116(1):13-20. doi: 10.1111/j.1748-1716.1982.tb10593.x [Crossref]
- Thorstensson ALF, Nilsson J, Carlson H, Zomlefer MR. Trunk movements in human locomotion. Acta Physiol Scand 1984;121(1):9-22. doi: 10.1111/j.1748-1716.1984.tb10452.x [Crossref]
- Okada T, Huxel KC, Nesser TW. Relationship between core stability, functional movement, and performance. J Strength Cond Res 2011;25(1):252-61. doi: 10.1519/JSC.0b013e3181b22b3e [Crossref]
- Moir GL. Biomechanics of fundamental movements: Sprint
running. Strength and conditioning: a biomechanical approach. Burlington, MA: Jones & Bartlett Learning; 2016. p.523-74. Available from: http://samples.jblearning.com/9781284034844/FrontMatter.pdf
- Loturco I, Contreras B, Kobal R, Fernandes V, Moura N, Siqueira F, et al. Vertically and horizontally directed muscle power exercises: Relationships with top-level sprint performance. PLoS One 2018;13(7). doi: 10.1371/journal.pone.0201475 [Crossref]
- Loturco I, Nakamura F, Kobal R, Gil S, Abad Cs, Cuniyochi Rr, et al. Training for power and speed: Effects of increasing or decreasing jump squat velocity in elite young soccer players. J Strength Cond Res 2015;29(10):2771-9. doi: 10.1519/JSC.0000000000000951 [Crossref]
- Moura F, Marche AL, Caetano FG, Torres RDS, Martins LEB, Cunha SA. Analysis of high-intensity efforts in Brazilian professional soccer players. Hum Mov 2017;18(5):55-62. doi: 10.1515/humo-2017-0043 [Crossref]
- Rommers N, Mostaert M, Goossens L, Vaeyens R, Witvrouw E, Lenoir M, et al. Age and maturity related differences in motor coordination among male elite youth soccer players. J Sports Sci 2019;37(2):196-203. doi: 10.1080/02640414.2018.1488454 [Crossref]
- Kiesel K, Plisky P, Butler R. Functional movement test scores improve following a standardized off-season intervention program in professional football players. Scand J Med Sci Sports 2011;21(2):287-92. doi: 10.1111/j.1600-0838.2009.01038.x [Crossref]