Rev Bras Fisiol Exerc. 2023;22:e225324
doi: 10.33233/rbfex.v22i1.5324
ORIGINAL ARTICLE
Strength profile of lower and upper limbs of young
people and adults from Grande Vitória, ES
Perfil
de força de membros inferiores e superiores de jovens e adultos da grande
Vitória, ES
Helvio de Oliveira Affonso1, Mylena Barros de Souza1, Angelo
Borgo Neto1
1Appto Assessoria Esportiva, Vitória, ES,
Brazil
Received: March 30, 2023; Accepted: April 23, 2023.
Correspondence: Helvio de Oliveira Affonso,
helvio@appto.com.br
How to cite
Affonso HO, Souza MB, Borgo Neto
S. Strength profile of lower and upper limbs of young people and adults from
Grande Vitória, ES. Rev Bras Fisiol Exerc. 2023;22:e225324. doi: 10.33233/rbfex.v22i1.5324
Abstract
Introduction: Aging
contributes to loss of functional mobility and quality of life, and,
consequently, health complications and diseases incidence. Objective:
The purpose of this study was to evaluate the strength levels of men (M) and
women (W) for lower (LL) and upper (UL) limbs in different age groups to map
the normative references of these profiles. Methods: 270 individuals,
adults, and non-athletes, aged between 20 and 59 years old and residing in the
metropolitan region of Vitória/ES, participated in the research. Separated into
groups having 160 (M) and 110 (W), in the age groups between 20 to 29 years
(A), 30 to 39 years (B), 40 to 49 years (C), and 50 to 59 years (D). Body
composition assessment: body mass, height, perimeters, bone diameters, and
skinfolds, using Sanny equipment and the fat
percentage determination using physical assessment software, Jackson and
Pollock protocol (7 skinfolds). Maximum isometric strength levels were assessed
using a computerized digital dynamometer. Results: The assessed
population shows a trend towards strength loss with age, especially from the
30-39 age group for men and women. Despite not being statistically significant,
the data make the loss of strength evident. Notably, low levels can also be
highlighted, following the references for functional health classification. Conclusion:
The assessed population shows a tendency towards loss of strength with age, in
addition to pointing out low levels of strength, according to the references
for functional health classification.
Keywords: strength; aging; longevity;
computerized digital dynamometry.
Resumo
Introdução: O envelhecimento contribui para a
chance de perda na mobilidade funcional e qualidade de vida e, por consequência,
complicações na saúde e incidência de doenças. Objetivo: A proposta
deste estudo foi avaliar os níveis de força de homens (H) e mulheres (M), para
membros inferiores (MI) e superiores (MS), em diferentes faixas etárias, com
objetivo de mapear os referenciais normativos desses perfis. Métodos:
Participaram da pesquisa 270 indivíduos, adultos e não atletas, com idades
entre 20 e 59 anos e residentes na região metropolitana de Vitória/ES.
Separados em grupos tendo 160 (H) e 110 (M), nas faixas etárias entre 20 a 29
anos (A), 30 a 39 anos (B), 40 a 49 anos (C) e 50 a 59 anos (D). Avaliação de
composição corporal: massa corporal, altura, perímetros, diâmetros ósseos e
dobras cutâneas, por equipamentos de marca Sanny e
determinação do percentual de gordura por software de avaliação física,
protocolo de Jackson e Pollock (7 dobras). Os níveis de força máxima isométrica
foram avaliados por um dinamômetro digital computadorizado. Resultados:
A população avaliada demonstra tendência de perda de força com o passar da
idade, destacadamente a partir do grupo 30-39 para homens e mulheres, apesar de
não serem estatisticamente significantes os dados deixam evidente a perda de
força. Conclusão: A população avaliada demonstra tendência para perda de
força com o passar da idade, além de apontar baixos níveis de força, conforme
as referências para classificação de saúde funcional.
Palavras-chave: força; envelhecimento; longevidade; dinamometria digital computadorizada.
Introduction
The city of Vitória is the capital
of the state of Espírito Santo, located in the
Southeast of Brazil. According to a survey by the Brazilian Institute of
Geography and Statistics (IBGE), until 2021, it had a population of
approximately 365,855 inhabitants, thus being classified as the metropolitan
region of the state. According to the publication of the SAÚDE program in Veja magazine, Vitória was in 3rd place in the ranking of
the survey “Brazilian Cities Friendly to Physical Activity”, carried out by
researchers from PUC-PR [1]. On the other hand, IBGE publications in 2019 point
out that 40.3% of the population over 18 years of age is considered
insufficiently active [2]. Subsequently, data from the Ministry of Health (MS)
in 2021 warns that, in Brazil, 48.3% of the population residing in the capitals
do not perform any type of physical activity [3]. In particular, people aged 55
and over. Also, in 2021, research results from Fiocruz
in partnership with UFMG and Unicamp show that 62% of
Brazilians stopped carrying out activities during the Covid
pandemic, increasing the percentage of sedentary people [4]. Sedentary behavior
contributes to the detraining of biomotor skills,
increasing the chance of health complications, as well as contributing to the
development of diseases, loss of functional mobility, and quality of life [5].
This fatality can contribute to a high level of overload in public health
systems [6].
The main biomotor
capacity affected by detraining is strength, and its decline is responsible for
a series of factors that compromise movement production and aid adaptations of
other conditioning capacities [7,8]. One of the factors, and indeed inevitable,
that can cause the decline in strength levels is aging [9]. In this process, a
set of structural, functional, and physiological alterations occur that
generate a loss in adaptability [10]. These changes are significant in the
neuromuscular system, tending towards muscle atrophy, and can lead to
limitations that expose older adults to the risk of pathological processes such
as sarcopenia [11,12,13].
Therefore, the purpose of this
study was to evaluate the strength levels of men (M) and women (W), for lower
(LL) and upper (UL) limbs, in different age groups through computerized digital
dynamometry to map the normative references of these profiles.
Methods
Study design
The project was approved by the
Research Ethics Committee of the University of Vila Velha
CAAE 78770017.0.0000.5064 in 2017.
Sample eligibility criteria
The non-probabilistic, purposeful,
careful sampling was composed of 270 individuals, adults and non-athletes, 160
(M) and 110 (W), all living in the metropolitan region of Vitória, aged between
20 and 59 years, divided into age groups: 20 to 29 years (A), 30 to 39 years
(B), 40 to 49 years (C), and 50 to 59 years (D). The sample calculation was
based on a confidence level of 95% and a margin of error of 6% for a population
of approximately 500,000 inhabitants. Inclusion criteria were: adults and
non-athletes, while exclusion criteria were: inability to produce force due to
injury or injury sequelae, as well as recent post-surgical patients (≤ 12
months).
Data collection
Data collection took place on the
same day as the strength assessments, and the data referring to the body
composition assessment were: body mass, height, perimeters, bone diameters, and
skinfolds. For this purpose, Sanny® equipment was
used, namely: a stadiometer, measuring tape, caliper, and adipometer,
in addition to a Tanita® scale. To determine the fat percentage, the protocol
by Jackson and Pollock (1978) 7 folds [14] and the physical evaluation software
Avaesportes were selected.
Strength assessment
All subjects underwent a 10-minute
warm-up on a Moviment® stationary bicycle, with a
rotation from 50 to 60 rpm and load adjustment to produce approximately 80-100
watts.
Maximum isometric strength levels
were evaluated by a computerized digital dynamometer (Power DIN, CEFISE®, Nova
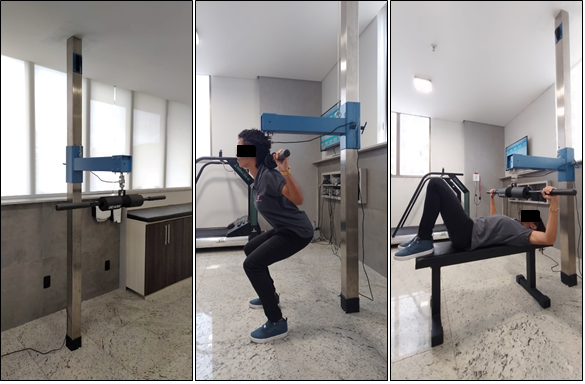
Odessa, São Paulo, Brazil) fixed to a solid 1.80 m bar; this bar fixed to a pole
with height adjustment and balancing counterweight (fig 1). Data referring to
peak force in kgf and N, average force in kgf and N, as well as the peak force expression time in
milliseconds, were found from the readings of the load cells and the 02-channel
signal acquisition system (interface), N2000 PRO CEFISE®. For measuring the
strength expression in the lower limbs, the subjects were submitted to the
position of the Half Back Squat exercise (half squat), performing strength only
in the concentric phase, and for the upper limbs, with the Benchpress
exercise position, also with the application of force only in the concentric
phase. All collections were carried out between 2018 and 2021, and the time
between strength measurements was 10 minutes to eliminate potential fatigue
that could generate false negatives.

Figure 1 - Equipment for Digital
Dynamometry, Half Squat, and Benchpress exercises
Statistical analysis
Descriptive analysis of the
results, mean and standard deviation, and ANOVA for independent samples was
performed to determine whether there were statistical differences between the
different age groups of the two subgroups; in addition, the Tukey post-hoc test
was performed for multiple comparisons.
Results
The tables below present the mean
values and standard deviation of all measurements collected in their respective
age groups and genders.
Table I - Mean and standard deviation
of data from the men20 to 29 years old (A), 30 to 39 years old (B), 40 to 49
years old (C), and 50 to 59 years old (D)

Table II - Mean and standard deviation
of data from the women 20 to 29 years old (A), 30 to 39 years old (B), 40 to 49
years old (C), and 50 to 59 years old (D)

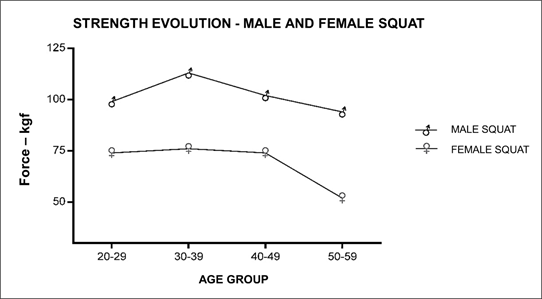
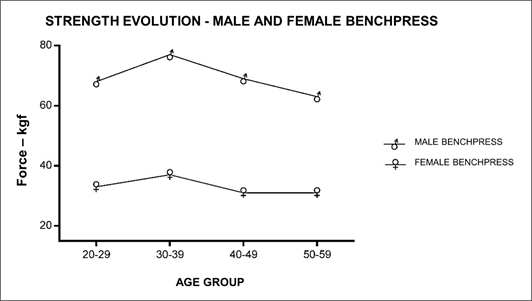
The graphs below present
comparative data on the evolution of the strengths of the evaluated men and
women.

Figure 2 - Evolution of strength by age
group – lower limbs – female and male

Figure 3 - Evolution of strength by age
group – upper limbs – female and male
Results of statistical analysis
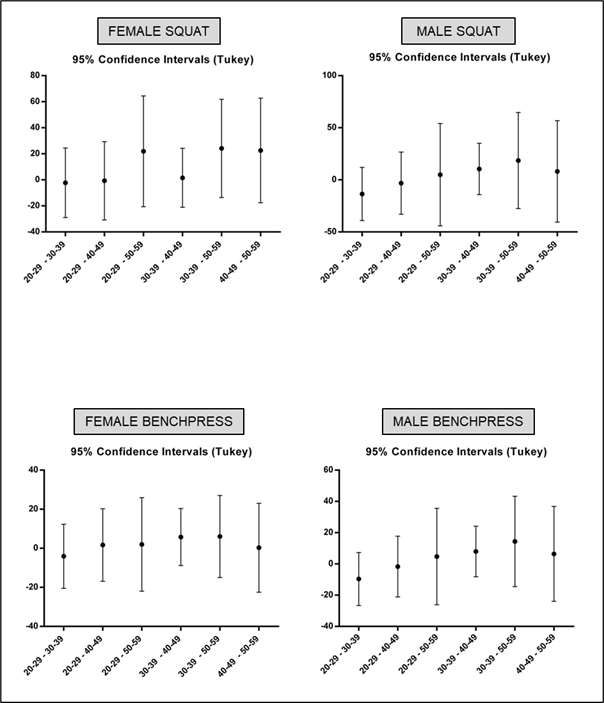
No statistically significant
differences were found between the age groups of the two subgroups when
analyzing ANOVA for independent samples and in the post-hoc Tukey test for
multiple comparisons. However, for the women group in the benchpress
exercise, Bartlett's test, there was a statistically significant difference
(**), p-value= 0.0094.

Figure 4 – Tukey post-hoc test for
multiple comparisons
Discussion
The assessed
population demonstrates a tendency towards loss of strength with age, especially
from the 30-39 age group for men and women; despite not being statistically significant,
the data make the loss of strength evident. Notably, low levels can also be
highlighted following the references for functional health classification.
Following references from Kraemer and Fleck [16], strength, in general, is an
essential biomotor capacity for maintaining health
concerning physiological functioning and functional capacity. Relatively, the
ability to apply force in values referring to 1 x kgf/body
weight for UL and 1.5 x kgf/body weight for LL are
classified as healthy levels [17]. Observing the LL and UL averages about the
body weight, all the evaluated ones present lower values when compared to the
data of this aforementioned reference.
Corroborating
the findings of this study, we can emphasize data from the literature that
point to aging as a set of structural and functional changes that are
unfavorable to the body, which generate loss of adaptability [18]. These
changes mean the loss of muscle fibers, loss of muscle strength and
functionality, and are also significant in the neuromuscular system, tending to
muscle atrophy [10].
According to Queiroga [20], research using handgrip strength to verify
the effects of aging on strength and resistance indices also revealed a
negative correlation with the evolution of age. Other studies [21] indicate the
possibility of postponing the worsening of this decline through physical
activities practice. In the comparison between genders, the main divergence in
the absolute strength value seems to be due to anthropometric measures. The
literature presents results in different scenarios, indicating lower values of
muscle strength in women related to differences in body size and muscle mass,
and they exhibit approximately two-thirds of the absolute strength of men
[22,23]. Furthermore, when it comes to the production of hormones, very
different results are found between men and women, directly influencing the
total production of muscle strength [24,25,26]. Considering the BMI and %BF
values, we urge you to cite studies carried out with older adults of both
genders as a sample, which indicates that there is no proven significant correlation
between these measurements and muscle strength performance [27,28,29,30].
In a practical
way, the research suggests that programs aimed at maintaining or gaining
strength are necessary from a specific age group onwards, both for men and
women. As a limitation of the study, it is worth highlighting the comparison of
strength levels of sedentary and active individuals in structured training with
an emphasis on maintaining or gaining strength.
Conclusion
The assessed population shows a
tendency towards loss of strength with age, in addition to pointing out low
levels of strength, according to the references, for the classification of
functional health. These findings suggest the real need for evaluations and
strength training programs for the general population, especially for older
adults, intending to minimize the risks of diseases and improve quality of
life, autonomy, and functional mobility.
Conflict of interest
There are no conflicts of interest.
Financing source
The study was carried out without
funding sources.
Authors' contribution
Conception and design
of the research: Affonso
HO; Data collection: Neto AB, Affonso HO, Souza MB; Data analysis and interpretation:
Affonso HO; Statistical analysis: Affonso HO; Manuscript writing: Affonso
HO, Souza MB; Critical review of the manuscript for important intellectual
content: Affonso HO.
References
- Rodrigo
R, Adriano A, Priscila G. Relatório do ranking das capitais brasileiras amigas
da atividade física. Veja Saúde [Internet]. 2018 [cited 2022 Jul 22]. Available from:
https://saude.abril.com.br/fitness/relatorio-do-ranking-das-capitais-brasileiras-amigas-da-atividade-fisica/?Fbclid=iwar3aktlopuqsagnfidhexgt5ohpkgaxpqc9p1onr3ycdvftwtlano8b5rjs
- Ana C.
IBGE: 40,3% dos adultos são considerados sedentários no Brasil. Agência Brasil
[Internet]. 2020 [cited 2022 Jul
22]. Available from:
https://agenciabrasil.ebc.com.br/saude/noticia/2020-11/ibge-403-dos-adultos-sao-considerados-sedentarios-no-brasil#:~:text=A%20Pesquisa%20Nacional%20de%20Sa%C3%bade,do%20que%20150%20minutos%20por
- Simone
B. 48,3% dos brasileiros das capitais não fazem nenhuma atividade física. Veja
[Internet]. 2023 [cited 2023 Mar 15]. Available from:
https://veja.abril.com.br/saude/483-dos-brasileiros-das-capitais-nao-fazem-nenhuma-atividade-fisica/
- Sabrina
B. Mais de 60% dos brasileiros estão sedentários na pandemia. Veja [Internet]. 2021 [cited 2022 Jul 12]. Available from:
https://veja.abril.com.br/ciencia/estudo-mais-de-60-dos-brasileiros-estao-sedentarios-na-pandemia/
- Hunter GR, McCarthy JP, Bamman
MM. Effects of resistance training on older adults. Sports Med. 2004;34(5):329-48. doi: 10.2165/00007256-200434050-00005 [Crossref]
- Ministério
da Saúde. Vigilância de fatores de risco e proteção para doenças crônicas por
inquérito telefônico. Vigitel Brasil [Internet]. 2021
[cited 2022 Jul 2]. Available from:
https://www.gov.br/saude/pt-br/centrais-de-conteudo/publicacoes/svsa/vigitel/vigitel-brasil-2021-estimativas-sobre-frequencia-e-distribuicao-sociodemografica-de-fatores-de-risco-e-protecao-para-doencas-cronicas#:~:text=Vigitel%20Brasil%202021%20%3A%20vigil%C3%a2ncia%20de,em%202021%20%2F%20Minist%C3%a9rio%20da%20Sa%C3%bade%2C
- Oliveira
F, Moreira D. Força de preensão palmar e diabetes mellitus. Rev
Bras Clin Med [Internet]. 2009 [cited 2022 Jul 2];7:251-255.
Available from: http://files.bvs.br/upload/S/1679-1010/2009/v7n4/a251-255.pdf
- Tavares
M, Filho B, Barbosa H, Vanderley I. Perfil de força
de preensão manual em pacientes idosos com câncer de próstata. Scientia
Medica. 2020;30:1-12. doi: 10.15448/1980-6108.2020.1.35399 [Crossref]
- Werle S, Goldhahn J, Drerup S, Simmen BR, Sprott H, Herren DB. Age- and
gender-specific normative data of grip and pinch strength in a healthy adult
Swiss population. J Hand Surg Eur
Vol. 2009;34(1):76-84. doi: 10.1177/1753193408096763 [Crossref]
- Spirduso
W. Dimensões físicas do envelhecimento. Boletim Informativo Unimotrisaúde
em Sociogerontologia. [Internet] Barueri, SP: Manole;
2005. [cited 2022 Out 12]. 482 p. Il.
ID: dan-1787 Available from:
https://periodicos.ufam.edu.br/index.php/BIUS/article/view/884
- Carvalho
J, Soares J. Envelhecimento e força muscular: breve revisão. Revista Portuguesa
de Ciências do Desporto. 2004;4(3):79-93. doi: 10.5628/rpcd.04.03.79 [Crossref]
- Correia
PP et al. Função neuromuscular no idoso: a importância do treino de força. In
Barreiro J, Espanha M, Correia PP, eds. Actividade
física e envelhecimento. Lisboa: Faculdade Motricidade Humana; 2006. p.135-53.
- Cruz-Jentoft
AJ, Bahat G, Bauer J, Boirie
Y, Bruyère O, Cederholm T,
et al. Writing Group for the European Working Group on
Sarcopenia in Older People 2 (EWGSOP2), and the Extended Group for EWGSOP2.
Sarcopenia: revised European consensus on definition and diagnosis. Age Ageing.
2019;48(1):16-31. doi: 10.1093/ageing/afy169 [Crossref]
- Jackson AS, Pollock ML, Ward A. Generalized equations
for predicting body density of men. Br J Nutr. 1978;40(3):497-504. doi: 10.1079/bjn19780152 [Crossref]
- Jackson AS, Pollock ML, Ward A. Generalized equations
for predicting body density of women. Med Sci Sports Exerc.
[Internet] 1980 [cited 2023 Apr 10]; 12:175-82.
https://pubmed.ncbi.nlm.nih.gov/7402053/
- Kraemer WJ, Fleck SJ, Evans WJ. Strength and power
training: Physiological mechanisms of adaptation. Exerc Sport Sci Rev [Internet]. 1996 [cited 2022 Apr 12];24:363-97. Available from: https://journals.lww.com/acsm-essr/citation/1996/00240/strength_and_power_training__physiological.14.aspx
- Guedes
D, Guedes J. Manual prático para avaliação em
educação física. São Paulo: Manole;
2006.
- Vieira
S, Granja KSB, Exel AL, Calles
ACN. A força muscular associada ao processo de envelhecimento. Ciênc Biol Saúde. [Internet].
2015 [cited 2022 Nov
22];3(1):93-102. Disponível em:
https://periodicos.set.edu.br/fitsbiosaude/article/view/2569
- Roos MR, Ri/ce CL, Vandervoort AA. Age-related changes in motor unit function.
Muscle Nerve.
1997;20(6):679-90. doi: 10.1002/(sici)1097-4598(199706)20:6<679::aid-mus4>3.0.co;2-5 [Crossref]
- Queiroga
M. Avaliação da aptidão músculo-esquelética. In:
Queiroga M. Testes e medidas para avaliação física relacionada à saúde em
adultos. Rio de Janeiro: Guanabara Koogan; 2005.
- Davini
R, Nunes CV. Alterações no sistema neuromuscular decorrentes do envelhecimento
e o papel do exercício físico na manutenção da força muscular em indivíduos
idosos. Braz J Phys Ther.
[Internet]. 2003;7(3):201-7. [citado 2023 jul 21]. Available from:
https://pesquisa.bvsalud.org/portal/resource/pt/lil-355041
- Morrow JR Jr, Hosler WW. Strength comparisons in untrained men and trained
women athletes. Med Sci Sports Exerc. [Internet]. 1981 [citado 2022 jul
10];13(3):194-7. Disponível em: https://pubmed.ncbi.nlm.nih.gov/7253873/
- Doherty TJ. The influence of aging and sex on skeletal muscle mass and strength. Curr Opin Clin Nutr Metab Care. 2001;4(6):503-8. doi: 10.1097/00075197-200111000-00007 [Crossref]
- Borst SE, De Hoyos DV, Garzarella L, Vincent K, Pollock BH, Lowenthal DT, Pollock
ML. Effects of resistance training on insulin-like growth factor-I and IGF
binding proteins. Med Sci Sports Exerc.
2001;33(4):648-53. doi: 10.1097/00005768-200104000-00021 [Crossref]
- Kraemer WJ, Staron RS,
Hagerman FC, Hikida RS, Fry AC, Gordon SE, et al. The
effects of short-term resistance training on endocrine function in men and
women. Eur J Appl Physiol Occup
Physiol. 1998;78(1):69-76. doi: 10.1007/s004210050389 [Crossref]
- Holloway JB, Baechle TR. Strength training for female athletes. A review of selected aspects. Sports Med. 1990;9(4):216-28. doi: 10.2165/00007256-199009040-00003 [Crossref]
- Roncato M, Galarza E, Freire B, Tiggemann CL, Dias CP. Correlação da força e composição corporal com a capacidade funcional em mulheres idosas. Rev Bras Ciencia Mov. 2014;22(1):122-30. doi: 10.18511/0103-1716/rbcm.v22n1p122-130 [Crossref]
- Pereira
L, Prestes J, Melo G, Neto L, Funghetto S, Pires A,
et al. A influência da composição corporal na força de homens idosos
brasileiros, Brasília, DF. Rev Bras
Med Esporte. 2015;21(3). doi: 10.1590/1517-869220152103132642 [Crossref]
- Trasser EM, Hofmann M, Franzke B, Schober-Halper B, Oesen S, Jandrasits W, et al. Strength training increases skeletal muscle quality but not muscle mass in old institutionalized adults: a randomized, multi-arm parallel and controlled intervention study. Eur J Phys Rehabil Med. 2018;54(6):921-33. doi: 10.23736/S1973-9087.18.04930-4 [Crossref]
- Reid KF, Pasha E, Doros G, Clark DJ, Patten C, Phillips EM, et al. Longitudinal decline of lower extremity muscle power in healthy and mobility-limited older adults: influence of muscle mass, strength, composition, neuromuscular activation and single fiber contractile properties. Eur J Appl Physiol. 2014];114(1):29-39. doi: 10.1007/s00421-013-2728-2 [Crossref]
