Rev Bras Fisiol Exerc 2022;21(4):246-54
doi: 10.33233/rbfex.v21i4.5337
ARTIGO ORIGINAL
Muscle fascicle length obtained by panoramic ultrasound and estimated by
prediction equations
Comprimento do
fascículo muscular obtido pela ultrassonografia panorâmica e estimado por
equações de predição
André Luiz Conveniente
Soares1, Paulo Sergio Chagas Gomes1
1Universidade do Estado do Rio de
Janeiro, Rio de Janeiro, RJ, Brazil
Received: November 18,
2022; Accepted: December
15, 2022.
Correspondence: André Luiz Conveniente Soares, andresoares94@hotmail.com
How to cite
Soares ALC, Gomes PSC. Muscle fascicle length obtained by panoramic ultrasound and estimated by prediction equations. Rev Bras Fisiol Exerc 2022;21(4):246-54. doi: 10.33233/rbfex.v21i4.5337
Introduction: B-mode ultrasound is limited to the size of the
transducer. However, the panoramic technique allows measuring the fascicle
length without using prediction equations. Objective: To compare the
fascicle length of the vastus lateralis obtained by panoramic ultrasound and
estimated by trigonometric equations. Methods: Fifteen men aged 24 ± 6
participated in the study. The research is characterized as a single-visit
comparative observational study. A panoramic ultrasound image of the vastus
lateralis was performed using a 4 cm linear transducer, with a frequency of 10
MHz and 6 cm of image depth, through a 13 cm scan. After collecting the images,
the panoramic fascicle length was compared and estimated by two different
prediction equations. Results: One-way ANOVA detected no significant
difference (P = 0.093). The analysis of percentage difference, coefficient of
determination, standard error of the estimate, and Pearson correlation
coefficient between the difference and the average of the panoramic measure
compared to equation 1 (D =
24.1%; R2 = 0.68; SEE = 0.9 cm; r = 0.796; p = 0.000) and equation 2
(D = 17.4%; R2
= 0.48; SEE = 1.1 cm; r = 0.695; p = 0.004) indicated proportion bias. Conclusion:
Although no significant difference was observed between the prediction
equations and the panoramic measure, the trigonometric equations showed an
overestimated fascicle length and a low agreement with the reference measure.
Keywords: exercise; hypertrophy; quadriceps muscle;
reproducibility; resistance training.
Resumo
Introdução: A ultrassonografia no modo B é
limitada ao tamanho do transdutor, entretanto a técnica panorâmica permite
mensurar o comprimento do fascículo sem a necessidade de utilizar equações de
predição. Objetivo: Comparar o comprimento do fascículo do vasto lateral
obtido pela ultrassonografia panorâmica e estimado por equações
trigonométricas. Métodos: Participaram do estudo 15 homens com idades de
24 ± 6 anos. A pesquisa caracteriza-se como um estudo observacional comparativo
de visita única. Foi realizada uma imagem de ultrassonografia panorâmica do
vasto lateral através de um transdutor linear de 4 cm, com frequência de 10 MHz
e 6 cm de profundidade de imagem, através de uma varredura de 13 cm. Após a
coleta das imagens, foi comparado o comprimento do fascículo panorâmico e
estimado por duas equações de predição diferentes. Resultados: A ANOVA
de uma via não detectou diferença significativa (P = 0,093). As análises de
diferença percentual, coeficiente de determinação, erro padrão da estimativa e
coeficiente de correlação de Pearson entre a diferença e a média da medida
panorâmica em comparação a equação 1 (D = 24,1%; R2 = 0,68; EPE =
0,9 cm; r = 0,796; p = 0,000) e equação 2 (D = 17,4%; R2
= 0,48; EPE = 1,1 cm; r = 0,695; p = 0,004) indicaram viés de proporção. Conclusão:
Apesar de não ter sido observada diferença significativa entre as equações de
predição e a medida panorâmica, as equações trigonométricas apresentaram uma
superestimativa do comprimento do fascículo e uma baixa concordância com a
medida de referência.
Palavras-chave: exercício físico; hipertrofia; músculo
quadríceps; reprodutibilidade dos testes; treinamento de força.
Introduction
B-mode ultrasound (US) is commonly used to monitor
muscle adaptations resulting from injury rehabilitation [1], resistance
training [2], stretching [3], or muscle atrophy [4]. US is a simple and
reliable technique to determine muscle architecture variables, such as muscle
thickness (MT), fascicle length (FL), and fascicle angle (FA) [5,6].
FL adaptations are associated with the type [7] and
speed of contraction [8], as well as the range of motion [9]. Therefore, motor
gestures such as jumps [10], sprints [11], and muscle power actions, in
general, are benefited from the addition of sarcomeres in series [12]. The
determination of the FL is justified in studies with treatment that seek to
improve the force-velocity relationship [13].
More recently, the panoramic US technique has
demonstrated the possibility of consistently providing an extended field of
view in a single scan [14]. The panoramic US allows the evaluator to observe an
extensive part of the muscle of interest without the limitation of the
transducer size through the rendering of superimposed static images [15]. Thus,
it is possible to observe the MT in different portions of the same muscle [16]
and to be able to quantify the entire FL without the need to use prediction
equations.
The FL prediction equations assume that the
superficial and deep aponeuroses of the muscle are parallel. The trigonometric
equations, such as those by Finni et al. [17]
and Kawakami et al. [18] assume that FL, MT, and deep aponeurosis form a
right triangle. The assumption is not necessarily supported, as the aponeuroses
and fascicles are not linear [19]. The FL prediction equations assume that the
superficial and deep aponeuroses of the muscle are parallel. The prediction
equations were developed when the size of the transducer and software were
limited by the technology available. However, with the improvement of software
and hardware, it is currently possible to render panoramic images in an US
device, being able to perform comparisons between the measurements of panoramic
and estimated FL by equations.
Therefore, the present study aimed to determine the
difference and agreement in the FL of the vastus lateralis obtained by
panoramic US and estimated by trigonometric equations.
Methods
Sample
Fifteen university men aged 24 ± 6 years, with a
stature of 1.77 ± 0.6 m and a body mass of 74.6 ± 8.1 kg, participated in the
study. The sample was for convenience and composed of Physical Education
undergraduate students. The eligibility criteria were: being between 18 and 40
years old, having a BMI < 30 kg/m2, not having a musculoskeletal
injury or existing health restrictions according to the PAR-Q questionnaire,
and not using nutritional supplementation or pharmacological aids.
Before entering the study, all participants read and
signed an informed consent form. The research was approved by the research
ethics committee of Hospital Universitário Pedro
Ernesto of the Universidade do Estado do Rio de
Janeiro, under protocol number 2.531.389 (CAAE: 76693917.2.0000.5259).
Study design
The research is characterized as a comparative
observational study. The participants made a single visit to the laboratory and
were previously instructed not to perform any moderate or intense physical
activity for at least 48 hours before the visit. Before starting the
procedures, the subjects were left to rest on a stretcher for 20 minutes to
stabilize the intramuscular fluid.
Procedures
The participants remained supine to perform a panoramic
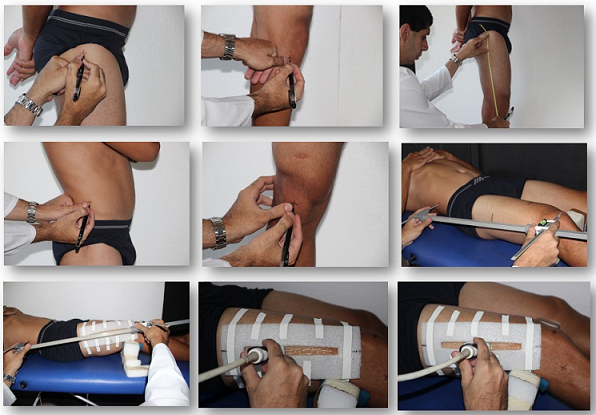
US image of the vastus lateralis muscle. A guide rail made of polyethylene foam
was positioned at 40% of the upper lateral border of the greater trochanter of
the femur and the upper limit of the lateral epicondyle of the tibia. The guide
rail was placed at a 15º inclination angle between the greater trochanter of
the femur, and the superior region of the patella, as shown in figure 1 [20].
Panoramic US images were recorded by a researcher using a GE LOGIQe ultrasound scanner (GE Healthcare, Chicago, IL, USA)
with a 4 cm 12L-RS linear transducer, with a frequency of 10 MHz and 6 cm of
image depth. Subsequently, a 13 cm scan was performed on the skin with a
conductive gel (Mercur, Santa Cruz do Sul, RS,
Brazil), applying minimal pressure to avoid deforming the tissues.

Figure 1 - Identification of anatomical sites for placement
of the guide rail and manipulation of the transducer over the vastus lateralis
muscle
After collecting the images, an independent researcher
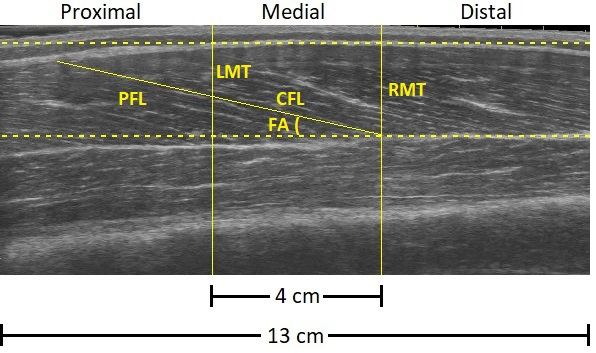
coded the files and divided the 13 cm panoramic images into three portions:
proximal, medial, and distal. The medial portion, in the center of the image,
was limited by the typical size of a 4 cm transducer. Images were analyzed
using open-access imaging software (ImageJ, ver. 1.50f, National Institutes of
Health, Bethesda, MD, USA). The following variables were quantified: panoramic
fascicle length (PFL), conventional fascicle length (CFL), right muscle
thickness (RMT), left muscle thickness (LMT), and FA. MT was measured in straight
line mode, FL in segmented line mode, and FA in angle tool mode. PFL
measurements were compared to estimated FL using equations 1 and 2 by Finni et al. [17] and Kawakami et al. [18],
respectively. Figure 2 shows a typical image of the vastus lateralis muscle
observed by panoramic US and typical demarcations of those generally used with
the conventional measure for predicting FL through trigonometric equations.

CFL = conventional fascicle length; PFL = panoramic
fascicle length; FA = fascicle angle; LMT = left muscle thickness; RMT = right
muscle thickness
Figure 2 - Panoramic ultrasound image of the vastus
lateralis muscle and typical demarcations of conventional ultrasound
Equation 1, Finni et al. [17]:

Equation 2, Kawakami et al. [18]:

CFL = conventional fascicle length; EFL = estimated
fascicle length; FA = fascicle angle; LMT = left muscle thickness; RMT = right
muscle thickness
Reliability and measurement error
In a recent study carried out by our laboratory, it
was observed that measurements performed on different days have high
consistency (ICCMT = 0.964; ICCFL = 0.947; ICCFA
= 0.942), low absolute error (TEMMT = 0.07 cm; TEMFL =
0.31 cm; TEMFA = 0.92º), and low variability between measurements
(CVMT = 2.9%; CVFL = 2.9%; CVFA = 4.1%) [21].
Thus, it is possible to attribute a greater power of certainty to the results
of the comparison between the FL obtained by the panoramic US and estimated by
equations 1 and 2 that used the variables MT, FA, and the FL itself for the
prediction calculation.
Statistical analysis
Shapiro-Wilk test was used to test the normality of
the distribution of the FL measurements and for the prediction variables (CFL,
EFL, FA, LMT, and RMT). To determine the difference between the three
measurement techniques used to determine the FL, a one-way analysis of variance
(ANOVA) was performed, as they are different measures, therefore, independent.
The mean of individual percentage differences (D = [PFL - EFL] x 100 / PFL) between the FL measurement
techniques was also calculated. Linear regression analysis, followed by the
coefficient of determination (R2) and the standard error of the
estimate (SEE), were used to verify how the FL variation predicted by equations
1 and 2 explains the variation of the panoramic measure. The agreement between
techniques was determined using the Bland-Altman graphical analysis [22],
followed by the Pearson correlation coefficient (r) between the difference and
the average of the FL measurements for each of the two equations used. The P
< 0.05 level of significance level was adopted for all analyses performed
using the Statistical Package for the Social Sciences software (IBM Corp.
Released 2012. IBM SPSS Statistics for Windows, Version 21.0. Armonk, NY: IBM
Corp.).
Results
Shapiro-Wilk test did not identify deviations from
normality for all FL measures and the prediction variables (CFL, EFL, FA, LMT,
and RMT) (P > 0.05). One-way ANOVA detected no significant difference between
the panoramic FL and those predicted by equations 1 and 2 (F = 2.519; P =
0.093). However, comparing the percentage difference between the panoramic
measurement and equation 1 (D =
24.1%) and equation 2 (D =
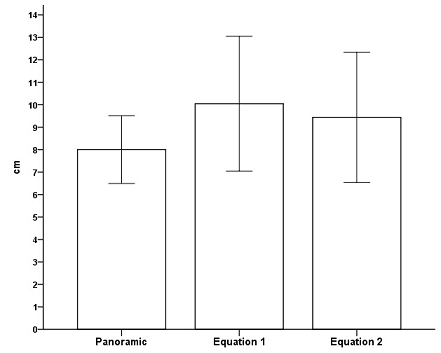
17.4%) suggests an overestimation of the FL measurement. Figure 3 graphically
shows the mean and standard deviation of the FL measurement techniques. Figure
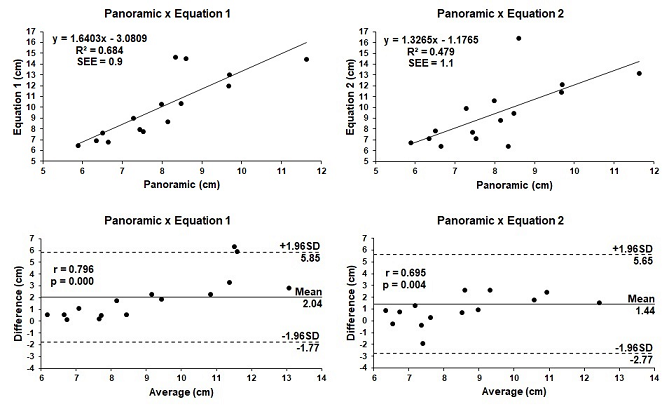
4 presents the linear regression analysis, R2, SEE, Bland-Altman,
and Pearson's r between the difference and the average of the FL measurements.

Figure 3 - Descriptive analysis (mean ± standard deviation)
of the fascicle length in centimeters (cm) obtained by panoramic ultrasound and
prediction equations

Figure 4 - Linear regression analysis followed by the
coefficient of determination (R2), standard error of the estimate (SEE), and
Bland-Altman followed by the Pearson correlation coefficient (r) between the
difference and the mean of the measures of the panoramic fascicle length and
predicted by equations 1 and 2
Discussion
FL obtained by the panoramic US served as a reference
to compare with the FL predicted by the equations of Finni
et al. [17] and Kawakami et al. [18]. However, no significant
difference was observed between the vastus lateralis FL obtained by the
panoramic US and predicted by trigonometric equations (P = 0.093).
Although equation 1 showed a lower variability when
compared to the panoramic measure (R2 = 0.684; SEE = 0.9 cm), there
was a higher percentage overestimation (D = 24.1%) when compared to equation 2 (D = 17.4%), which showed a higher variability (R2
= 0.479; SEE = 1.1 cm). In addition, the Bland-Altman graphical analysis,
followed by Pearson's r between the difference and the average, showed
proportion bias in comparing the panoramic FL against equation 1 (r = 0.796; p
= 0.000) and equation 2 (r = 0.695; p = 0.004). The observed errors and the FL
values overestimated by equations 1 and 2 reinforce the need for caution when
using FL prediction equations in the vastus lateralis muscle.
Reeves et al. [23] observed a 10.7% increase in
FL using the equation by Finni et al. [17].
However, the adaptation was lower than the percentage difference of 24.1% found
by equation 1 compared to the reference measure. Alegre et al. [24]
detected a 10.5% increase in FL using Kawakami et al. [18] equation.
However, the percentage difference between equation 2 and the panoramic measure
was 17.4% in the present study.
Although there was no statistical difference between
the techniques, it cannot be assumed that when interventions, such as
resistance training, are performed, predicted FL measures of the vastus
lateralis will be reproducible over time.
Equation 1 [17] was developed from the measurement of
FL limited to a conventional US field of view size. FL prediction value was
based on the distance between the end of the FL in the proximal part of the
image to the superficial aponeurosis and the sine of the FA. The measure of FL,
estimated by equation 2 [18], used a trigonometric relationship where
measurements of the MT of the distal part of the image and the sine of the FA
are necessary. On the other hand, the image produced by the panoramic US allows
the total visualization of the target fascicle.
Prediction equations are not limited to studies with
the vastus lateralis muscle but any pennate muscle. A similar study compared
different FL prediction equations with the panoramic measurement of the FL of
the biceps femoris obtained by panoramic US [25]. However, it is worth
mentioning that previous studies that aimed to determine the difference between
the measurement of the reference FL and the prediction equations used different
statistical methods. Some studies considered the different techniques as
repeated measures [19,25,26], while others did not [27,28]. The procedure used
can be a limitation when comparing the results of different studies. The
present study considered the different FL prediction techniques as independent
measures.
As previously shown, the prediction equations assume
that the superficial and deep aponeuroses of the muscle are parallel and that
the fascicle is always a straight line, making clear the limitations of conventional
US to measure the FL in its entirety [28]. On the other hand, to perform the
panoramic measurement, it is necessary to have an experienced rater who
maintains constant practice to obtain rendered images without tissue
deformation [29]. Therefore, our laboratory suggests that before collecting and
quantifying the panoramic or estimated FL measurements, the rater should be
trained in the entire process (marking anatomical sites, image acquisition by
the US, and FL measurement via software) and have its reliability and
measurement error previously tested.
Conclusion
Although no significant difference was observed
between the prediction equations and the reference measure, the trigonometric
equations overestimated the FL. Therefore, in the absence of the panoramic
technique, equations 1 and 2 can be used to predict the FL of the vastus
lateralis muscle obtained by the conventional US. However, one should be
cautious when interpreting the results, as there was no high agreement with the
reference measure, which can be an error factor in cases of interventions that
perform repeated measures.
Academic affiliation
This article represents the final product of a
graduate discipline carried out by André Luiz Conveniente
Soares, M.Sc., and supervised by Paulo Sergio Chagas Gomes, Ph.D.
Funding source
Soares ALC
is a Ph.D. scholarship holder at the
Fundação de Amparo à Pesquisa do Estado do Rio de Janeiro (FAPERJ). Process: 260003/014681/2022
Conflict of interest
The authors declare no conflict of interest.
Authors’ contribution
Research conception and design: Soares ALC, Gomes PSC; Data collection: Soares ALC; Data
analysis and interpretation: Soares ALC, Gomes PSC; Statistical analysis:
Soares ALC, Gomes PSC; Writing of the manuscript: Soares ALC; Critical
review of the manuscript: Gomes PSC
References
- Devrimsel G, Metin Y, Beyazal MS. Short-term
effects of neuromuscular electrical stimulation and ultrasound therapies on
muscle architecture and functional capacity in knee osteoarthritis: a randomized
study. Clin Rehabil 2019;33(3):418-27. doi: 10.1177/0269215518817807 [Crossref]
- Ema R, Wakahara T, Miyamoto N, Kanehisa H, Kawakami Y. Inhomogeneous architectural changes of the quadriceps femoris induced by resistance training. Eur J Appl Physiol 2013;113(11):2691-2703. doi: 10.1007/s00421-013-2700-1 [Crossref]
- Blazevich AJ, Cannavan D, Waugh CM, Miller SC, Thorlund JB, Aagaard P et al. Range of motion, neuromechanical, and architectural adaptations to plantar flexor stretch training in humans. J Appl Physiol 2014;117(5):452-62. doi: 10.1152/japplphysiol.00204.2014 [Crossref]
- Yang JH, Eun SP, Park DH, Kwak HB, Chang E. The effects of anterior cruciate ligament reconstruction on individual quadriceps muscle thickness and circulating biomarkers. Int J Environ Res Public Health 2019;16(24):4895. doi: 10.3390/ijerph16244895 [Crossref]
- Oranchuk DJ, Nelson AR, Storey AG, Cronin JB. Variability of regional quadriceps architecture in trained men assessed by B-mode and extended-field-of-view ultrasonography. Int J Sports Physiol Perform 2020;15(3):430-36. doi: 10.1123/ijspp.2019-0050 [Crossref]
- Chino K, Akagi R, Dohi M, Takahashi H. Measurement of muscle architecture concurrently with muscle hardness using ultrasound strain elastography. Acta Radiol 2014;55(7):833-9. doi: 10.1177/0284185113507565 [Crossref]
- Timmins RG, Ruddy JD, Presland J, Maniar N, Shield AJ, Williams MD, et al. Architectural changes of the biceps femoris long head after concentric or eccentric training. Med Sci Sports Exerc 2016;48(3):499-508. doi: 10.1249/MSS.0000000000000795 [Crossref]
- Lieber RL, Fridén J. Functional and clinical significance of skeletal muscle architecture. Muscle Nerve 2000;23(11):1647-66. doi: 10.1002/1097-4598(200011)23:11<1647::aid-mus1>3.0.co;2-m [Crossref]
- Valamatos MJ, Tavares F, Santos RM, Veloso AP, Mil-Homens P. Influence of full range of motion vs. equalized partial range of motion training on muscle architecture and mechanical properties. Eur J Appl Physiol 2018;118(9):1969-83. doi: 10.1007/s00421-018-3932-x [Crossref]
- Nikolaidou ME, Marzilger R, Bohm S, Mersmann F, Arampatzis A. Operating length and velocity of human M. vastus lateralis fascicles during vertical jumping. R Soc Open Sci 2017;4(5):170185. doi: 10.1098/rsos.170185 [Crossref]
- Kumagai K, Abe T, Brechue WF, Ryushi T, Takano S, Mizuno M. Sprint performance is related to muscle fascicle length in male 100-m sprinters. J Appl Physiol 2000;88(3):811-6. doi: 10.1152/jappl.2000.88.3.811 [Crossref]
- Thom JM, Morse CI, Birch KM, Narici MV. Influence of muscle architecture on the torque and power-velocity characteristics of young and elderly men. Eur J Appl Physiol 2007;100(5):613-9. doi: 10.1007/s00421-007-0481-0 [Crossref]
- Blazevich AJ. Effects of physical training and detraining, immobilisation, growth and aging on human fascicle geometry. Sports Med 2006;36(12):1003-17. doi: 10.2165/00007256-200636120-00002 [Crossref]
- Hagoort I, Hortobágyi T, Vuillerme N, Lamoth CJC, Murgia A. Age- and muscle-specific reliability of muscle architecture measurements assessed by two-dimensional panoramic ultrasound. Biomed Eng Online 2022;21(1):15. doi: 10.1186/s12938-021-00967-4 [Crossref]
- Elliott ST. A user guide to extended field of view in ultrasonography. Ultrasound 2006;14(1):55-8. doi: 10.1179/174313405X83597 [Crossref]
- Arruda BR, Soares ALC, Carvalho RF, Gomes PSC. Reliability and measurement error of the proximal, medial and distal portions of the vastus lateralis muscle thickness measured with extended field of view ultrasonography. Kinesiol 2022;54(1):107-14. doi: 10.26582/k.54.1.11 [Crossref]
- Finni T, Ikegawa S, Lepola V, Komi PV. Comparison of force-velocity relationships of vastus lateralis muscle in isokinetic and in stretch-shortening cycle exercises. Acta Physiol Scand 2003;177(4):483-91. doi: 10.1046/j.1365-201X.2003.01069.x [Crossref]
- Kawakami Y, Abe T, Kuno SY, Fukunaga T. Training-induced changes in
muscle architecture and specific tension. Eur J Appl Physiol
Occup Physiol
1995;72(1-2):37-43 doi: 10.1007/BF00964112
- Pimenta R, Blazevich AJ, Freitas SR. Biceps femoris long-head architecture assessed using different sonographic techniques. Med Sci Sports Exerc 2018;50(12):2584-94. doi: 10.1249/MSS.0000000000001731 [Crossref]
- Gomes PSC, Soares ALC,
Meirelles CM. Técnicas ultrassonográficas para determinação de medidas de
arquitetura e qualidade muscular: aplicações nas áreas de ciências do
exercício, esporte e saúde. In: Neves AN, Muniz AMS, Meirelles CM, et al.
Ciência aplicada ao exercício físico e ao esporte. 1 ed. Curitiba: Appris; 2022. p.221-35.
- Soares ALC, Nogueira FS, Gomes PSC. Assessment methods of vastus lateralis muscle architecture using panoramic ultrasound: a new approach, test-retest reliability and measurement error. Braz J Kinanthrop Hum Perform 2021;23:e76402. doi: 10.1590/1980-0037.2021v23e76402 [Crossref]
- Bland JM, Altman DG. Statistical methods for assessing agreement between two methods of clinical measurement. Lancet 1986;327(8476):307-10. doi: 10.1016/S0140-6736(86)90837-8 [Crossref]
- Reeves ND, Narici MV, Maganaris
CN. Effect of resistance training on skeletal muscle-specific force in elderly
humans. J Appl Physiol 2004;96(3):885-92. doi: 10.1152/japplphysiol.00688.2003 [Crossref]
- Alegre LM, Jiménez F, Gonzalo-Orden JM, Martín-Acero R, Aguado X. Effects of dynamic resistance training on fascicle length and isometric strength. J Sports Sci 2006;24(5):501-8. doi: 10.1080/02640410500189322 [Crossref]
- Franchi MV, Fitze DP, Raiteri BJ, Hahn D, Spörri J. Ultrasound-derived biceps femoris long head fascicle length: extrapolation pitfalls. Med Sci Sports Exerc 2020;52(1):233-43. doi: 10.1249/MSS.0000000000002123 [Crossref]
- Ripley N, Comfort P, McMahon J. Comparison between methods to estimate bicep femoris fascicle length from three estimation equations using a 10 cm ultrasound probe. Meas Phys Educ Exerc Sci 2022. doi: 10.1080/1091367X.2022.2063689 [Crossref]
- Ando R, Taniguchi K, Saito A, Fujimiya M, Katayose M, Akima H. Validity of fascicle length estimation in the vastus lateralis and vastus intermedius using ultrasonography. J Electromyogr Kinesiol 2014;24(2):214-20. doi: 10.1016/j.jelekin.2014.01.003 [Crossref]
- Brusco CM, Pinto RS, Blazevich AJ. Reliability and comparison of sonographic methods for in vivo measurement of human biceps femoris long-head architecture. Med Sci Sports Exerc 2022;54(2):2216-26. doi: 10.1249/MSS.0000000000003015 [Crossref]
- Cleary CJ, Nabavizadeh O, Young KL, Herda AA. Skeletal muscle analysis of panoramic ultrasound is reliable across multiple raters. PLoS One 2022;17(5):e0267641. doi: 10.1371/journal.pone.0267641 [Crossref]
